
2 Measuring Addiction and Youth Substance Use
Reading Objectives
By the end of this chapter, you should be able to:
- Distinguish substance use, substance-related harms, substance use disorder, and addiction, using person-first and non-stigmatizing language.
- Explain operationalization and distinguish constructs, observed variables, indicators, scale scores, and composite variables.
- Evaluate reliability, validity, and measurement error as limits on what a recorded value can show.
- Compare youth self-report, structured interviews, caregiver reports, and toxicology measures, including the distinct evidence and limitations each provides.
- Interpret how survey wording, response formats, reference periods, visual aids, and gating or skip logic shape survey variables.
- Prepare to explore measurement data by using instrument documentation to interpret values, special codes, skipped items, and not-applicable responses.
- Apply ethical principles to substance-use measurement by interpreting sensitive information cautiously and communicating findings precisely.
Key Terms
Addiction; composite variable; exploratory data analysis (EDA); gating and skip logic; indicator; instrumentation; latent construct; measurement error; observed variable; operationalization; reference period; reliability; scale score; substance-related harms or consequences; substance use; substance use disorder (SUD); toxicology measure; validity.
2.1 Addiction, Substance Use Disorder, and Person‑First Language
From cultural representation to scientific measurement
Before encountering a research study, most people have already developed ideas about substance use and addiction. Those ideas emerge from cultural images and stories, including films, music, advertising, news, and social media, as well as from social experiences and perspectives shaped by communities, neighborhoods, homes, families, friendships, schools, and other social worlds. In many social circles and subcultures, substance use may be normalized in everyday life, identity, or belonging.
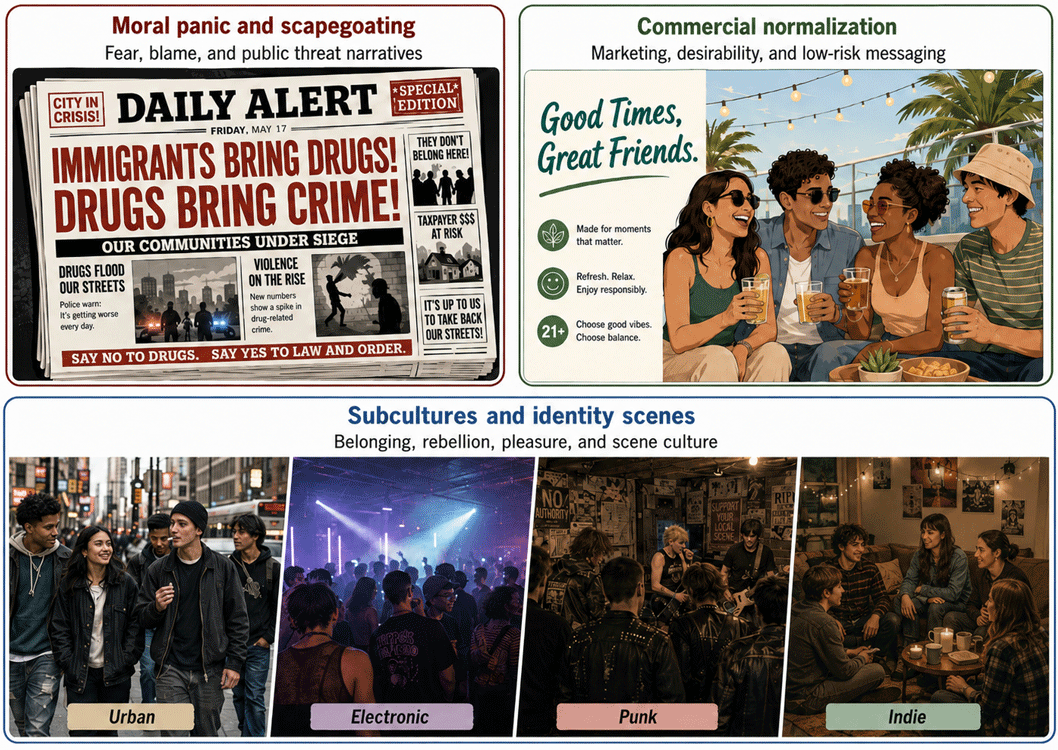
Research on substance use and addiction topics approach these questions differently – researchers define concepts carefully, follow documented procedures for collecting information, and interpret evidence cautiously. They ask what behavior or experience is being described, who provided the information, when it was collected, what a response or laboratory result means, and what conclusions the measure can and cannot support.
Before examining a dataset, researchers must distinguish among substance use, substance-related harms or consequences, substance use disorder (SUD), and addiction.
Distinguishing substance use, substance-related harms, SUD, and addiction
Substance use refers broadly to the consumption of alcohol, nicotine, cannabis, medications, or other psychoactive substances. A survey question asking whether someone has ever tried alcohol measures lifetime use; a question asking how many days they used cannabis in the past month measures recent frequency. Each item may be important for a study, but none alone establishes that a person has an addiction or a substance use disorder. Researchers also study substance‑related problems or harms, such as difficulty meeting responsibilities, conflict with family or friends, risky behavior, health concerns, or spending substantial time obtaining, using, or recovering from a substance.
In clinical settings, substance use disorder (SUD) refers to a pattern of symptoms related to substance use that causes clinically meaningful impairment or distress. The Diagnostic and Statistical Manual of Mental Disorders (DSM‑5) organizes SUD symptoms into four broad domains, a concise summary is provided in Table 2.1 (American Psychiatric Association, 2013). Clinicians and researchers use structured questions to assess symptoms across these domains and determine whether diagnostic criteria are met and how severe the disorder may be. Repeated substance use can affect brain systems involved in reward, stress, learning, motivation, and self-control (Koob & Volkow, 2016; National Institute on Drug Abuse, 2020).
Table 2.1 DSM‑5 symptom domains for substance use disorder
| DSM‑5 symptom domain | Example question a measure might ask |
| Impaired control | Has the person used more than intended, had difficulty cutting down, spent substantial time using or recovering, or experienced strong cravings? |
| Social impairment | Has substance use interfered with responsibilities, relationships, school, work, or important activities? |
| Risky use | Has the person continued using in dangerous situations or despite knowing that use is contributing to physical or psychological problems? |
| Pharmacological criteria | Has the person experienced tolerance or withdrawal? |
The word addiction is widely used in clinical, public‑health, and everyday settings, often referring to severe, persistent, and compulsive use despite harmful consequences. In this course, addiction is treated as a complex health and developmental issue rather than a moral failing (NIDA July 2020). Repeated substance use can affect brain systems involved in reward, stress, learning, motivation, and self‑control. These biological processes interact with social, developmental, and environmental factors. Substance‑related outcomes may reflect interactions among substance availability, developmental stage, mental health, family relationships, stress and trauma, school and neighborhood contexts, genetic differences, and access to prevention and treatment. Not every person exposed to risk will develop a substance use disorder, and biology does not determine anyone’s future, but multiple levels of influence should be considered.
Why person‑first language matters
The language used to describe substance use influences public attitudes, clinical interactions, willingness to seek care, and interpretations of research findings. Stigmatizing language can imply that a diagnosis or behavior defines a person or that substance‑related problems result from moral failure. Person‑first language keeps the person visible while describing a health condition, behavior, or experience accurately. Individuals and communities may sometimes choose identity‑first terms, but researchers should not assume that a label is preferred. Table 2.2 illustrates person‑first terminology.
Table 2.2 Examples of person‑first, non‑stigmatizing language
| Prefer | Avoid | Why |
| Person with a substance use disorder | addict; drug abuser | Describes a condition without defining the person by it. |
| Person who uses drugs/substances | user; abuser | Distinguishes behavior from identity and avoids moralizing language. |
| Person with alcohol use disorder | alcoholic; drunk | Uses clinical or descriptive language rather than a label. |
| Person in recovery | former addict; reformed addict | Avoids implying moral failure or a fixed identity. |
| Substance‑related harms or consequences | drug problem; drug abuse | Encourages researchers to specify what was measured or experienced. |
| Positive toxicology result / negative toxicology result | dirty test / clean test | Describes the laboratory result without stigmatizing the participant. |
| Note. Adapted from National Institute on Drug Abuse (2021). | ||
Precision in terminology improves scientific accuracy. For example, a positive toxicology result indicates that a substance or its metabolite was detected in a specimen within the assay’s detection window. It does not, by itself, establish how often someone uses a substance, whether use caused harm, whether the person meets diagnostic criteria, or why the exposure occurred. Similarly, a self‑report of no recent use does not automatically mean that a participant was dishonest if it differs from a toxicology result. Different measures may cover different time periods, capture different forms of exposure, or be affected by recall, privacy concerns, detection limits, or study procedures. Later sections discuss why researchers often combine multiple sources of evidence.
With these distinctions in place, we can turn to the central question of Module 2: How do researchers translate complex experiences and conditions into measurable variables?
2.2 Operationalization: From Theory to Measurable Variables
Connecting concepts to data
Researchers are often interested in concepts that cannot be placed directly into a spreadsheet. Questions such as “Does perceived harm reduce the likelihood of substance use?” or “Is a young person experiencing cravings, withdrawal, or difficulty controlling use?” refer to ideas that matter in the real world. Before researchers can analyze them, they must decide what information will serve as evidence, who will provide that information, when it will be collected, which instrument or procedure will be used, what the possible values mean, and how those values should be interpreted. This process is called operationalization.
Operationalization specifies how an abstract concept will be represented through observable information. It connects a research question to a dataset. A useful way to think about operationalization is as a sequence:
Table 2.3 From theory to variables
| Stage | Example |
| Theory | Lower perceived harm may be associated with greater willingness to try cannabis. |
| Construct | Perceived harm of cannabis use. |
| Measure | Youth survey question about how risky cannabis use seems. |
| Variable | Recorded response (e.g., coded from 1 to 5). |
The recorded value is useful, but it is not identical to the construct. A response of 2 or 5 is a recorded answer to a particular question, with specific wording, response options, timing, and study conditions. Researchers should interpret it as evidence about perceived harm, not as a complete representation of a participant’s beliefs. Operational definitions may differ across studies depending on the research question, population, resources, and timeframe. For example, recent nicotine exposure might be operationalized via a saliva assay for cotinine, while perceived harm might be measured via a survey item. Both pertain to substance use but produce very different variables.
Observed variables and latent constructs
An observed variable is a value recorded in a dataset. Examples include age, number of days of reported cannabis use, a yes/no interview response, a survey item score, reaction time on a cognitive task, cotinine concentration, a caregiver‑reported family‑history item, or a coded category representing a participant’s study visit.
Researchers must always think critically about observed values. Participants may misunderstand a question, forget an event, interpret a response option differently than another participant, or decide not to disclose sensitive information. Devices have limited precision, assays have detection thresholds, and measures may represent only specific time periods. Analysts should neither treat every recorded value as unquestionable truth nor dismiss imperfect data as useless. Instead, they should ask how, when, and under what conditions each value was produced.
Some important ideas cannot be captured fully by a single observed variable. These are often called latent constructs. A latent construct is an idea or condition that cannot be directly observed as a single raw value—examples include impulsivity, perceived harm, motivation, depression, or substance‑use‑disorder severity. Researchers study latent constructs by collecting indicators—observable responses, behaviors, scores, or measurements that provide evidence about the construct.
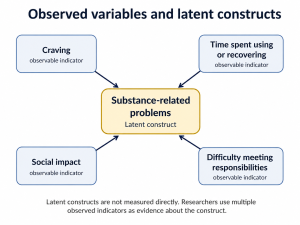
Indicators can be combined in different ways. A scale score is a value derived from a set of related items, often through a sum or average. A composite variable is a new variable created by combining two or more values using documented rules. For example, consider four hypothetical indicators of substance‑related problems (craving, continued use despite conflict, missed responsibilities, and time spent using or recovering). Researchers might create a count of endorsed indicators, calculate the proportion endorsed, create a binary indicator for whether any problem was reported, or apply a diagnostic scoring algorithm. Each approach serves a different purpose, and combining items is useful only when the items represent related aspects of a coherent construct and when the scoring rule is justified.
Measurement error, reliability, and validity
Measurement error refers to differences between a recorded value and the construct researchers intend to represent. This does not necessarily mean that someone made a mistake or acted dishonestly. Error is a predictable feature of studying complex human experiences, behaviors, and biological processes. A participant may not remember the exact number of days they used a substance; two participants may interpret a survey item differently; a biological assay may not detect exposure outside its detection window.
Researchers evaluate measures using two related but distinct concepts: reliability and validity. Reliability concerns whether a measure produces sufficiently consistent information under comparable conditions. Validity concerns whether evidence supports the interpretation that a measure represents the construct it is intended to represent. These concepts are summarized in Table 2.4 (Raykov & Marcoulides, 2011.
Table 2.4 Distinguishing reliability and validity
| Question | Reliability | Validity |
| Main concern | Is the measure consistent? | Does it represent the intended construct? |
| Example problem | Results change unpredictably under comparable conditions. | The measure consistently captures something other than its stated target. |
| Why it matters | Unstable data are difficult to interpret. | Consistent but misleading data can still produce incorrect conclusions. |
| Note. Adapted from foundational psychometric concepts described by Raykov and Marcoulides (2011). |
||
A measure can be reliable without being valid. For instance, a questionnaire might yield similar scores each time it is administered but still fail to represent the concept researchers intended to measure. Conversely, a measure cannot provide strong evidence about a construct if it produces highly inconsistent information. At this stage, students do not need to calculate reliability coefficients or conduct psychometric analyses; the important point is to ask whether a measure is consistent, whether its interpretation is justified, and what limitations accompany its use.
Choosing a measure depends on the question
No measurement approach is universally best. A useful measure fits a clearly defined research question. Table 2.5 provides examples of research questions, corresponding measures, and important limitations.
Table 2.5 Choosing measures to match research questions
| Research question | Measure that may be useful | Important limitation |
| How many days did adolescents report using cannabis in the past month? | Youth self‑report survey | May be affected by recall or disclosure concerns. |
| Was there recent nicotine exposure? | Cotinine assay from urine or saliva | May not identify the source, pattern, or disorder. |
| Are substance‑related problems changing over time? | Repeated survey or interview scale | Requires consistent timing and scoring. |
| Does a participant meet diagnostic criteria? | Structured diagnostic interview | Requires a diagnostic instrument and a documented scoring algorithm. |
Operationalization thus bridges ideas and data. Later sections examine specific instruments used to measure youth substance use and highlight what each can and cannot show.
2.3 Measurement Approaches for Youth Substance Use
Operationalization is the broader, iterative process of translating a construct into observable indicators, measures, timeframes, and scoring rules. Instrumentation refers more specifically to the tools and procedures used to collect those indicators, such as surveys, interviews, laboratory assays, or cognitive tasks.
In youth substance-use research, evidence may come from self-report surveys, structured interviews, caregiver or other-informant reports, and biological assays such as toxicology measures. No single instrument answers every question. The ABCD Study combines several of these approaches in its youth substance-use assessment procedures (Lisdahl et al., 2018).
Youth self‑report and structured interviews
A youth self‑report measure asks a young person to describe their own experiences, behaviors, beliefs, symptoms, or circumstances. Self‑report is central to substance‑use research because many important questions concern information that cannot be observed by a caregiver, teacher, researcher, or laboratory test. Youth may be the best source of information about whether they have heard of or encountered a substance; whether they have used a substance; the age or circumstances of first use; frequency, quantity, route, or timing of use; perceived harm, curiosity, motives, intentions, or expectations; cravings or difficulty controlling use; and social, school, family, or health consequences associated with use.
Self‑report can be collected through a self‑administered survey—often a digital questionnaire—or a structured interview conducted by a trained interviewer. Self‑administered surveys may provide more privacy for sensitive questions but rely on participants’ interpretation of the item wording. Structured interviews allow interviewers to clarify terms and apply consistent follow‑up questions but may influence responses through social context, time, or privacy constraints. Neither approach is perfect; both must be interpreted in light of their administration mode, question wording, response options, reference period, and confidentiality procedures.
Caregiver and other‑informant reports
Young people are often the best source of information about their private experiences, but they are not the only source of evidence. Caregivers and other informants may provide useful information about family history, household rules, supervision, medications, observed behavior, or changes over time. A caregiver report may contribute information about family history of substance‑related problems, household context, medications, changes in behavior or functioning, household stressors or supports, and circumstances that may not be visible in a youth survey. Youth and caregiver reports may agree, partially agree, or differ. A difference does not automatically mean that one person is lying or that one measure failed; informants may have different perspectives, opportunities for observation, expectations, definitions of a behavior, or reasons for interpreting an event differently.
Biological assays and toxicology measures
A biological assay measures a substance, metabolite, biomarker, or other biological feature in a specimen. In substance‑use research, toxicology measures provide evidence about biological exposure during the period that a given specimen and assay can detect it. Common specimen types include breath, saliva or oral fluid, urine, and hair. Each provides different kinds of information and has different interpretive limits:
- Breath tests can provide evidence of very recent alcohol exposure but do not describe longer‑term patterns or a substance use disorder.
- Saliva or oral‑fluid assays can detect recent exposure to selected substances but depend on timing, substance properties, and assay procedures.
- Urine assays can detect recent exposure or metabolite presence but do not necessarily indicate current impairment, source of exposure, or frequency of use.
- Hair assays can provide evidence of exposure over a longer historical period for some substances but do not precisely establish timing, context, or pattern of use.
A biological result does not explain the whole story. A positive toxicology result indicates detectable exposure within the detection window but does not establish how often a participant uses a substance, why they were exposed, where or with whom use occurred, whether they were impaired, whether they have a substance use disorder, or whether they experienced harms. A negative result does not establish that a participant has never used a substance; exposure may have occurred outside the assay’s detection period, involved a substance not included in the testing panel, or been below the detection threshold. Sample quality, collection timing, and laboratory procedures also affect whether an analyte is detected.
Comparing measurement approaches
Researchers may compare self‑report with biological measures to understand substance use more fully. Agreement can strengthen confidence, but disagreement does not automatically mean that one source is wrong. Before interpreting agreement or disagreement, researchers must examine the survey question, reference period, specimen timing, and documentation. Table 2.6 summarizes the broad kinds of evidence provided by each measurement approach and their main limitations.
Table 2.6 Comparing measurement approaches for youth substance use
| Approach | Evidence it may provide | Main interpretive limitation |
| Youth self‑report / structured interview | Private experiences, motives, context of use, timing, frequency, quantity, perceived harm, cravings, consequences. | May be affected by recall, interpretation, disclosure concerns, or social context. |
| Caregiver or other informant report | Family history, household context, medications, observed behavior, changes over time. | May not capture private experiences or undisclosed use; informants have limited observability. |
| Biological assay (breath, saliva/oral fluid, urine, hair) | Evidence of recent or historical biological exposure. | Does not by itself provide information about frequency, context, motives, impairment, or diagnosis; detection depends on timing, substance, and assay characteristics. |
Different measures provide different evidence. Self‑report can reveal motivations, timing, and context; caregiver reports can reveal household conditions; biological assays can reveal exposure. Researchers often combine these sources to build a more complete picture, but they must interpret each measure according to its design and limitations.
2.4 Survey Design and Response Formats
A survey is not merely a list of questions; it is a measurement system. The wording of a question, the response options offered, the timeframe specified, and the rules determining who receives a question all shape what a response means. Before interpreting a survey variable, researchers need to know what was asked, who answered, what answers were possible, which time period the question covered, and whether the question applied to every participant.
Open‑ended and closed‑ended questions
Open‑ended questions allow participants to answer in their own words. They can provide detail about experiences, meanings, or circumstances that researchers did not fully anticipate. For example: “Describe any concerns you have about substance use in your community.” Open‑ended responses can be valuable, but they are not immediately ready for a simple table or graph; researchers may need to read, code, or categorize them before quantitative analysis.
Closed‑ended questions provide a defined set of response options. They make it easier to compare responses across participants and to organize responses into structured variables. For example: “During the past 30 days, on how many days did you use cannabis?” with response categories such as 0 days, 1–2 days, 3–5 days, 6 or more days. Closed‑ended questions support consistent data collection but can limit what participants are able to express. A useful survey balances standardization with enough response options to represent participants’ experiences meaningfully.
Table 2.7 Common closed‑ended response formats
| Response format | Example | What the response represents |
| Binary question | “Have you ever tried vaping nicotine?” (Yes / No) | Whether a participant reports one of two possible conditions or experiences. |
| Multiple‑choice question | “Which nicotine products have you used?” (Cigarettes / E‑cigarettes / Smokeless tobacco / None / Other) | A selected category or categories. |
| Rating scale | “How harmful do you think weekly cannabis use would be for someone your age?” (No risk / Slight risk / Moderate risk / Great risk) | An ordered judgment, belief, attitude, or level of experience. |
Response codes have no meaning by themselves. A value of 4 might mean “four days,” “agree,” “great risk,” a category code, or something else entirely. Analysts must know exactly what each code represents.
Visual aids can support standardized reporting
Some substance-use questions require participants to estimate quantities or identify products, tasks that can be difficult without a shared reference point. Visual aids can show standard drug dose sizes, product types, or modes of use so that participants can more easily connect their experiences to the study’s definitions and response options.
In the ABCD Study, visual aids are included in some substance-use assessment procedures. A standard-drink chart, for example, can help participants recognize that different beverage types and serving sizes may represent a similar amount of alcohol. Visual aids do not eliminate recall error or make self-report fully objective, but they can reduce ambiguity and support more consistent reporting across participants. In the ABCD Study, visual aids are included in some substance-use assessment procedures, including materials that help participants estimate alcohol quantities and identify common cannabis products or modes of use (Lisdahl et al., 2018).
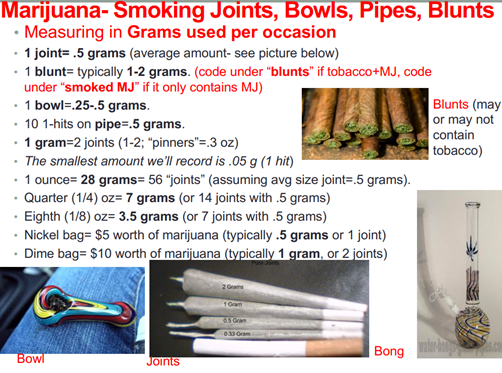
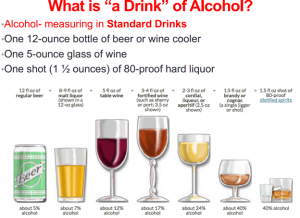
These examples help participants translate familiar products, modes of use, and serving sizes into shared survey units. Visual aids can reduce ambiguity in quantity questions, although they do not eliminate recall error or other limits of self-report. Images reproduced from Lisdahl et al. (2018), Developmental Cognitive Neuroscience supplementary material. Licensed CC BY-NC-ND 4.0. Not covered by this textbook’s CC BY license.
Reference periods define the variable
A reference period tells participants which period of time to consider when answering a question. It is part of the variable’s definition. Common reference periods include ever in a participant’s lifetime, the past year, the past 30 days, the past week, or today. “Ever used,” “used in the past month,” and “used today” are not different versions of the same variable; they describe different timeframes and support different conclusions. Reference periods matter especially in longitudinal research, where a question may be repeated at several study visits; comparisons across time are meaningful only when the wording, response options, timing, and scoring rules are documented and sufficiently comparable.
Gating and skip logic
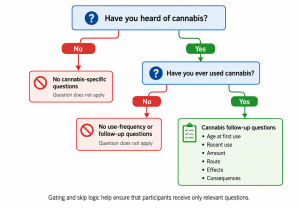
Gating is a survey‑design process in which an earlier answer determines whether later questions are asked. For example, a survey might first ask whether a participant has heard of cannabis. A participant who answers “No” is not asked cannabis‑specific questions, preventing irrelevant items and avoiding introducing participants to substances they have not encountered. A participant who answers “Yes” may then be asked whether they have ever used cannabis. Only those who report use receive follow‑up questions about frequency, quantity, route, context, and consequences. An empty cell in a dataset may therefore indicate that a question did not apply to that participant, not that information is missing.
Sensitive questions, privacy, and response quality
Surveys may also include features intended to evaluate response quality, such as attention checks, consistency checks, or questions about nonexistent substances. In the ABCD Study, endorsement of a fictitious substance can prompt staff to invite clarification and allow a participant to revise a response. Such checks are not labels for participants or proof of dishonesty. They are pieces of information that may indicate misunderstanding, inattention, uncertainty, or another reason to review the response and its collection conditions more carefully.
These design choices determine what a survey variable means and how it should be interpreted once it appears in a dataset.
2.5 Preparing to Explore Measurement Data
Vu and Harrington (2021, Chapter 1) introduce numerical summaries, frequency tables, bar charts, histograms, two-way tables, and other exploratory tools. Exploratory data analysis (EDA) is an early step in working with a dataset. It involves using tables, summaries, and visualizations to examine which values are present, how they are distributed, and which patterns or questions deserve closer attention. In this course, EDA begins with one central principle: before summarizing a variable, understand how it was produced.
Before creating or interpreting a table, bar chart, histogram, or other summary, analysts should ask:
- What exactly was the question or measurement procedure?
- Who provided the information?
- What response options or measurement units were available?
- What period of time did the measure cover?
- Which participants were eligible to receive the question or complete the procedure?
- How are skipped, missing, not-applicable, and quality-control values represented?
- Was the value recorded directly, scored, or derived from other responses or measurements?
These questions help analysts avoid treating every number, category, or blank cell as self-explanatory. For example, before summarizing a variable labeled “past-30-day cannabis use,” an analyst must determine whether it represents a count of days or a response category, whether all participants received the question, and whether special codes distinguish missing data from questions that did not apply. An unexpected value is not automatically an error. It may reflect a skipped question, a documented special code, a legitimate but uncommon experience, or a feature of the measure that requires consultation of the documentation.
Vu and Harrington Chapter 1 introduces numerical summaries, frequency tables, bar charts, histograms, two-way tables, and other exploratory tools. In this course, the additional question is: What does a summary mean, given how the underlying information was measured and documented? Exploratory analysis is therefore more than a technical exercise. It is an opportunity to check whether the data appear consistent with the measure, the study design, and the available documentation. Analysts describe what they observe and record questions for further investigation; they do not yet diagnose participants, make causal claims, or make major cleaning decisions. Those decisions are addressed in Module 3.
2.6 Ethical Considerations in Measurement
Chapter 1 introduced consent, privacy, confidentiality, and responsible data use as parts of the biomedical data journey. In substance‑use research, these responsibilities also shape measurement itself. Questions about substance use, mental health, family relationships, and health can be sensitive, especially when research involves young people. Researchers should use understandable, nonjudgmental language; explain relevant privacy protections; and collect information only when justified by the study’s purpose. Respectful measurement supports both participant dignity and better‑quality evidence.
Biological measures require careful interpretation. A toxicology result provides evidence of detectable exposure within a detection window, but it does not automatically establish substance use disorder, impairment, irresponsibility, deception, or a complete behavioral history. Researchers should avoid conclusions that exceed what a measure can support. The same principle applies when reporting results. Use phrases such as “reported cannabis use” rather than “admitted drug use,” “positive toxicology result” rather than “dirty test,” and “self‑report and toxicology differed” rather than “the participant was dishonest.” These distinctions are especially important when research concerns young people or communities that have historically been stigmatized or surveilled.
Ethical measurement can be summarized in three imperatives:
- Ask respectfully. Use nonjudgmental language and collect only information justified by the study’s purpose.
- Interpret cautiously. Recognize the limitations of each measure and avoid over‑interpreting discordant results.
- Report precisely. Distinguish evidence from judgment and use person‑first, non‑stigmatizing language.
Ethical measurement does not end when data are collected. It continues when researchers decide what a variable means, how differences across measures should be interpreted, and how findings should be communicated.
2.7 Chapter Summary
This chapter introduced how researchers translate concepts such as substance use, perceived harm, cravings, and substance‑related problems into measurable information. A variable is not the same as the construct it represents. It is a recorded value produced through a particular instrument, procedure, scoring rule, reference period, and study context. Youth reports, caregiver reports, and biological assays can each contribute useful evidence, but they answer different questions. Self‑report can describe timing, context, beliefs, and perceived experiences. Caregiver reports can describe household and family context. Biological assays can provide evidence of detectable exposure. Agreement across measures may strengthen an interpretation, while disagreement should prompt questions about timing, measurement design, and documentation rather than immediate judgment.
Survey wording, response options, reference periods, and gating determine who receives a question and what a response means. Before summarizing or graphing a variable, an analyst must understand the measure and its documentation. Exploratory data analysis should be measurement‑aware – analysts should check documentation before summarizing a variable, interpret unexpected values as questions rather than automatic errors, and postpone major cleaning decisions until appropriate.
References
American Psychiatric Association. (2013). Diagnostic and statistical manual of mental disorders (5th ed.). American Psychiatric Publishing.
Koob, G. F., & Volkow, N. D. (2016). Neurobiology of addiction: A neurocircuitry analysis. The Lancet Psychiatry, 3(8), 760–773. doi:10.1016/S2215-0366(16)00104-8
Lisdahl, K. M., Sher, K. J., Conway, K. P., Gonzalez, R., Feldstein Ewing, S. W., Nixon, S. J., Tapert, S., Bartsch, H., Goldstein, R. Z., & Heitzeg, M. (2018). Adolescent brain cognitive development (ABCD) study: Overview of substance use assessment methods. Developmental Cognitive Neuroscience, 32, 80–96. doi:10.1016/j.dcn.2018.02.007
National Institute on Drug Abuse. (2020, July). Drugs, brains, and behavior: The science of addiction. National Institutes of Health.
National Institute on Drug Abuse. (2021). Words matter: Preferred language for talking about addiction. National Institutes of Health.
Raykov, T., & Marcoulides, G. A. (2011). Introduction to psychometric theory. Routledge.
Vu, J., & Harrington, D. (2021). Introductory statistics for the life and biomedical sciences (1st ed., version August 8, 2021). OpenIntro.