"

1 The Biomedical Data Journey: Research Process, Infrastructure, and Ethics

Reading Objectives

After reading this chapter, you should be able to:

  1. Explain how a broad research topic becomes a research question, hypothesis, and study design, including the roles of explanatory, outcome, demographic, and contextual variables.
  2. Distinguish observational from experimental studies and explain why observational associations, including those observed over time, do not by themselves establish causation.
  3. Describe the biomedical data journey from study design and participant encounters through data capture, processing, documentation, controlled access, analysis, and responsible reuse.
  4. Explain how data infrastructure shapes research data, including the roles of participants, caregivers, staff, study sites, instruments, laboratories, identifiers, secure transfer, storage, and quality-control procedures.
  5. Interpret the basic structure and documentation of a biomedical dataset, including DataFrames, units of observation, participant and visit identifiers, metadata, data dictionaries, codebooks, provenance, and data states.
  6. Apply foundational principles of ethical and responsible data use, including privacy, confidentiality, re-identification risk, controlled access, data-use agreements, secure storage and deletion, responsible interpretation of race and ethnicity variables, and appropriate citation and acknowledgment.
  7. Explain why reproducible notebook workflows and synthetic data support responsible learning and analysis, while distinguishing reproducibility from correctness, causal validity, or replication.

Key Terms

Biomedical data journey; data governance; data infrastructure; hypothesis; research question; study design; variable.

Introduction: From Research Questions to Analytic Datasets

Substance use and related harms are often reduced to matters of personal choice or morality. Such narratives overlook the many influences that shape behavior and health, including development, family and peer environments, stress, opportunity, policy, biology, and access to resources. When people who use substances are blamed for “bad choices,” important social and structural factors remain invisible and stigma grows. This course begins from a broader, evidence‑based view – questions about addiction and health require attention to multiple influences and careful data collection.

Anti-drug poster that reads “SAY ‘NO’ TO CRACK AND OTHER DRUGS,” featuring McGruff the Crime Dog pointing, plus smaller panels explaining risks and refusal tips.
Figure 1.1. “Say ‘No’ to crack and other drugs” poster featuring McGruff the Crime Dog. Contributor: United States Department of Education. Source: National Library of Medicine (History of Medicine), via Wikimedia Commons. Rights status: No known copyright restrictions.

Scientific inquiry starts with questions rather than assumptions. Researchers ask how elements of a young person’s environment relate to later outcomes—for example, how neighbourhood social support or sleep quality relates to substance use, or how stress and peer relationships shape development. Such questions cannot be answered by inspecting a spreadsheet alone. They call for a process that spans study design, measurement, data collection, curation, analysis, and ethical governance. Data do not appear spontaneously; they are created through an organised journey.

A value in a dataset might originate in a youth’s survey response, a caregiver interview, a computer‑based task, a laboratory analysis of a specimen, or a brain‑imaging session. That value may be collected by a research coordinator, interviewer, technician, or clinician. It may be checked for quality, assigned an identifier, linked to documentation, transferred through secure systems, and stored under rules that limit who can access it and how it may be used. Every row in a dataset has a history.

Before researchers can analyze data, they must make a series of deliberate decisions – decide what they want to understand; design a study that can address the question; determine which people and experiences to include; select ways to measure important concepts; protect participants and their information; and document how the resulting data should be interpreted. These choices shape every later step and must be revisited when interpreting results.

The biomedical data journey provides a framework for tracing this process. It highlights four connected stages: (1) framing and designing the study; (2) recruiting participants and collecting data; (3) processing, checking, and documenting the data; and (4) governing, analyzing, reporting, and responsibly reusing data. Each stage builds on those that precede it. A change in recruitment, measurement, or documentation influences what analysts can do later. Figure 1.2 illustrates these stages, reminding us that the rows and columns seen in a DataFrame are the end product of a long chain of human, technical, and ethical decisions.
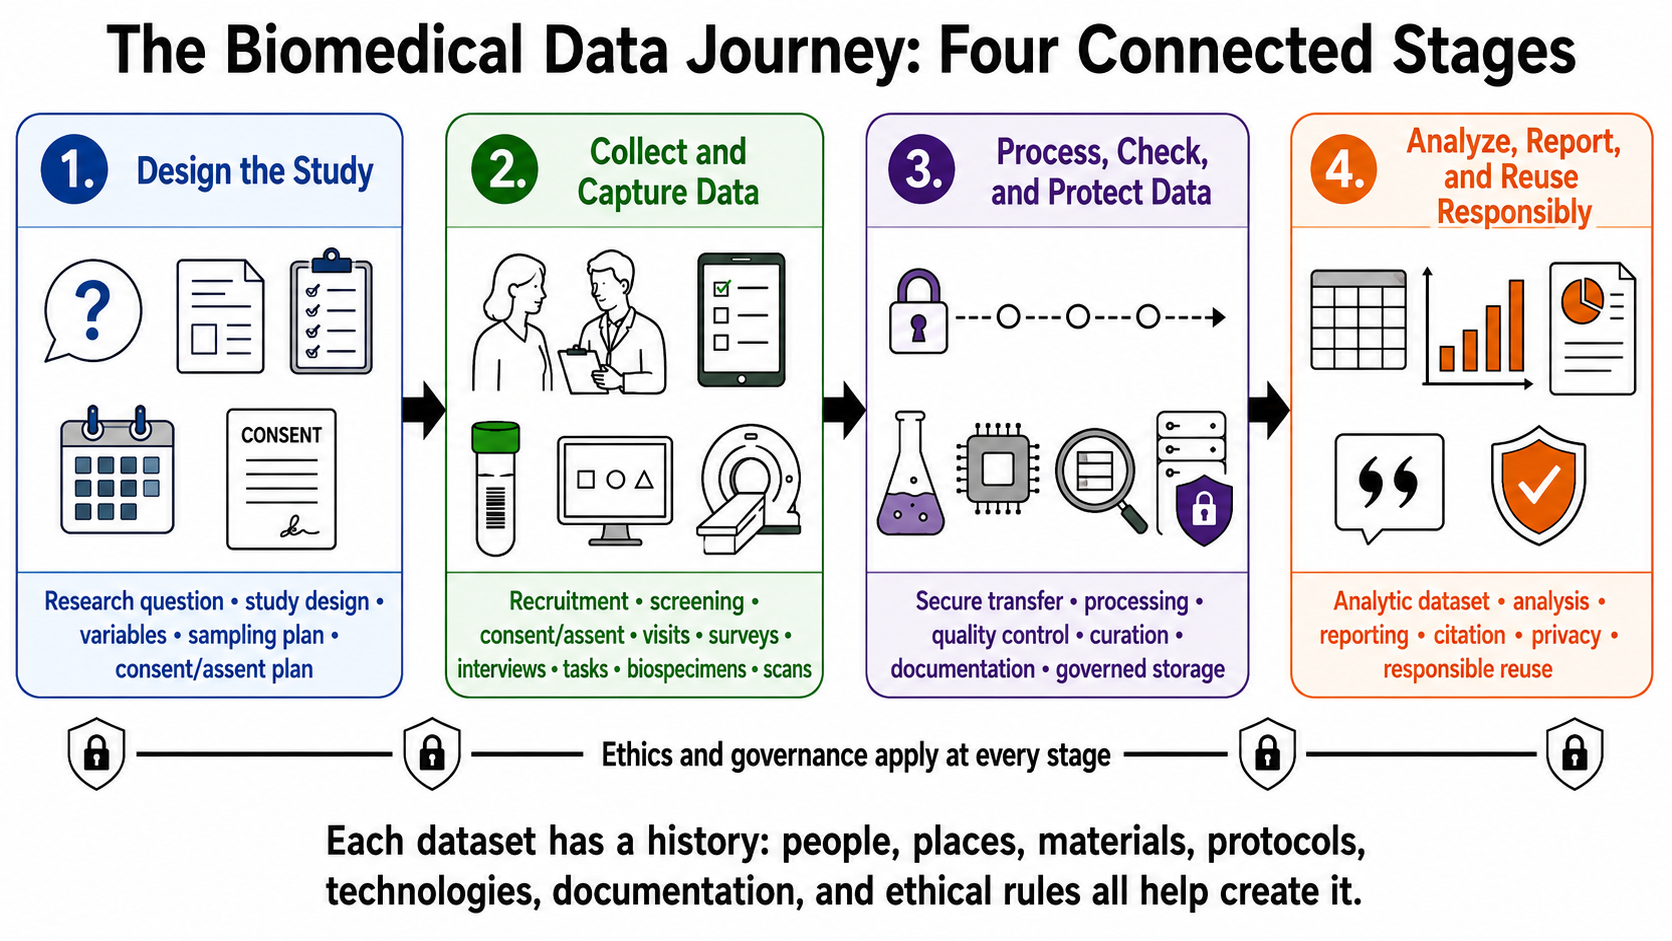
A left-to-right flowchart titled “The Biomedical Data Journey: Four Connected Stages.” Four connected boxes show: Design the Study; Collect and Capture Data; Process, Check, and Protect Data; and Analyze, Report, and Reuse Responsibly. Each box includes a title, simple icons, and one short line of keywords. Stage 1 includes research question, study design, variables, sampling plan, and consent/assent planning. Stage 2 includes recruitment, screening, consent/assent, visits, surveys, interviews, tasks, biospecimens, and scans. Stage 3 includes secure transfer, processing, quality control, curation, documentation, and governed storage. Stage 4 includes the analytic dataset, analysis, reporting, citation, privacy, and responsible reuse. A line below the sequence states that ethics and governance apply at every stage. The diagram emphasizes that biomedical research data are created through people, protocols, instruments, technology, documentation, and ethical safeguards.
Figure 1.2. The Biomedical Data Journey: Four Connected Stages.

Throughout this course we will return to the Adolescent Brain Cognitive Development (ABCD) Study as a running example. ABCD is a large, multisite longitudinal study that follows more than 11,000 children across 21 sites for a decade, collecting data on health, behaviour, cognition, social environment, substance use, biological measures, and brain development. Its scale and multimodal design enable questions that no single survey, clinic, or laboratory could answer. At the same time, its complexity means that analysts must know what each variable represents, who provided it, when and how it was collected, what the possible values mean, whether data are missing, and what the study design can and cannot support. Sensitive information about young people, families, health, substance use, genetics, and brain development carries ethical responsibilities.

This chapter establishes foundational concepts for DSARM 1. You will learn how broad topics become research questions, how theory leads to constructs, measures, and variables, and how hypotheses are formulated and tested. You will learn the difference between exploratory and confirmatory questions, and between explanatory, outcome, demographic, and contextual variables. You will examine study designs (observational versus experimental, cross‑sectional versus longitudinal), sampling and recruitment, and the basic structure of a DataFrame. You will see why observational studies can identify important patterns but do not alone establish causation. You will explore the physical and digital infrastructure that makes data possible, the documentation that enables interpretation, and the ethical principles that govern responsible data use.

2. From Question to Study Design

2.1 From Broad Topics to Specific Questions

Health researchers often begin with a broad topic, such as youth development and substance use. A topic captures a general area of curiosity, but it does not yet specify what will be measured or how relationships will be tested.

To make progress, researchers refine that topic into a research question: an inquiry that identifies relationships, patterns, descriptions, or changes that can be investigated empirically.

A scientific research question always includes variables. For example, instead of asking:

How do teenagers grow up?

An addiction research project might ask:

How is neighborhood social support related to later cannabis use among adolescents?

This question identifies a population, proposes a relationship between two variables, and invites data collection.

Broad topics and research questions emerge from theory and prior evidence. Theory explains why certain relationships might exist. Constructs are the abstract concepts that theory proposes. Measures translate constructs into observable quantities. Variables are the measured values we analyze.

Each step should be explicit:

Theory → Construct → Measure → Variable

For instance, the construct stress might be measured by a validated questionnaire or a biomarker. A research question might then connect stress as an explanatory variable to another variable, such as sleep quality, as the outcome variable.

When a relationship is expected, researchers often formulate a hypothesis: a specific, testable prediction that can be falsified.

2.1.1 Exploratory and Confirmatory Questions

Research questions come in two main forms.

Exploratory questions ask broadly about patterns or associations without specifying which variables explain which outcomes. For example:

What factors most influence substance use among urban high school students?

Exploratory work is common when relationships have not been extensively studied. It allows researchers to examine large datasets, identify patterns, and generate new hypotheses.

Confirmatory questions test specific relationships derived from theory or prior evidence. For example:

Does peer support reduce risk of substance use among urban high school students?

This confirmatory question proposes a direction of effect between a predictor and an outcome. It may lead to a hypothesis such as:

Adolescents with higher peer support will show lower substance use frequency over the next year compared with those with lower peer support.

Exploratory questions are useful for discovery. Confirmatory questions enable rigorous testing of hypotheses.

2.1.2 Explanatory, Outcome, Demographic, and Contextual Variables

Researchers classify variables by their role in a question.

An outcome variable is the focus of a question. It represents the result to be explained. It is sometimes called a dependent variable or response variable.

An explanatory variable is expected to influence the outcome. It is often called an independent variable or predictor.

Demographic variables describe characteristics of participants, such as age, gender, race, or socioeconomic status.

Contextual variables capture features of the environment, such as family, neighborhood, school, policy, or historical context, that may shape outcomes.

For example, if a study asks how weekly cannabis use is related to academic performance, then weekly cannabis use is the explanatory variable and academic performance is the outcome variable. Participants’ age and neighborhood deprivation could be demographic and contextual variables, respectively.

The ABCD Study, which follows more than 11,000 young people across 21 sites for ten years, provides many examples. A broad topic might be:

Adolescent brain development and substance use.

A research question could ask:

How does sleep quality in early adolescence relate to later cognitive performance?

In this question, sleep quality is the explanatory variable. It might be measured by actigraphy or self-report. Cognitive performance is the outcome variable. It might be measured by standardized tests.

Demographic and contextual variables could include age, sex, family income, and parental education. Because ABCD collects repeated measures over a decade, researchers can investigate change over time.
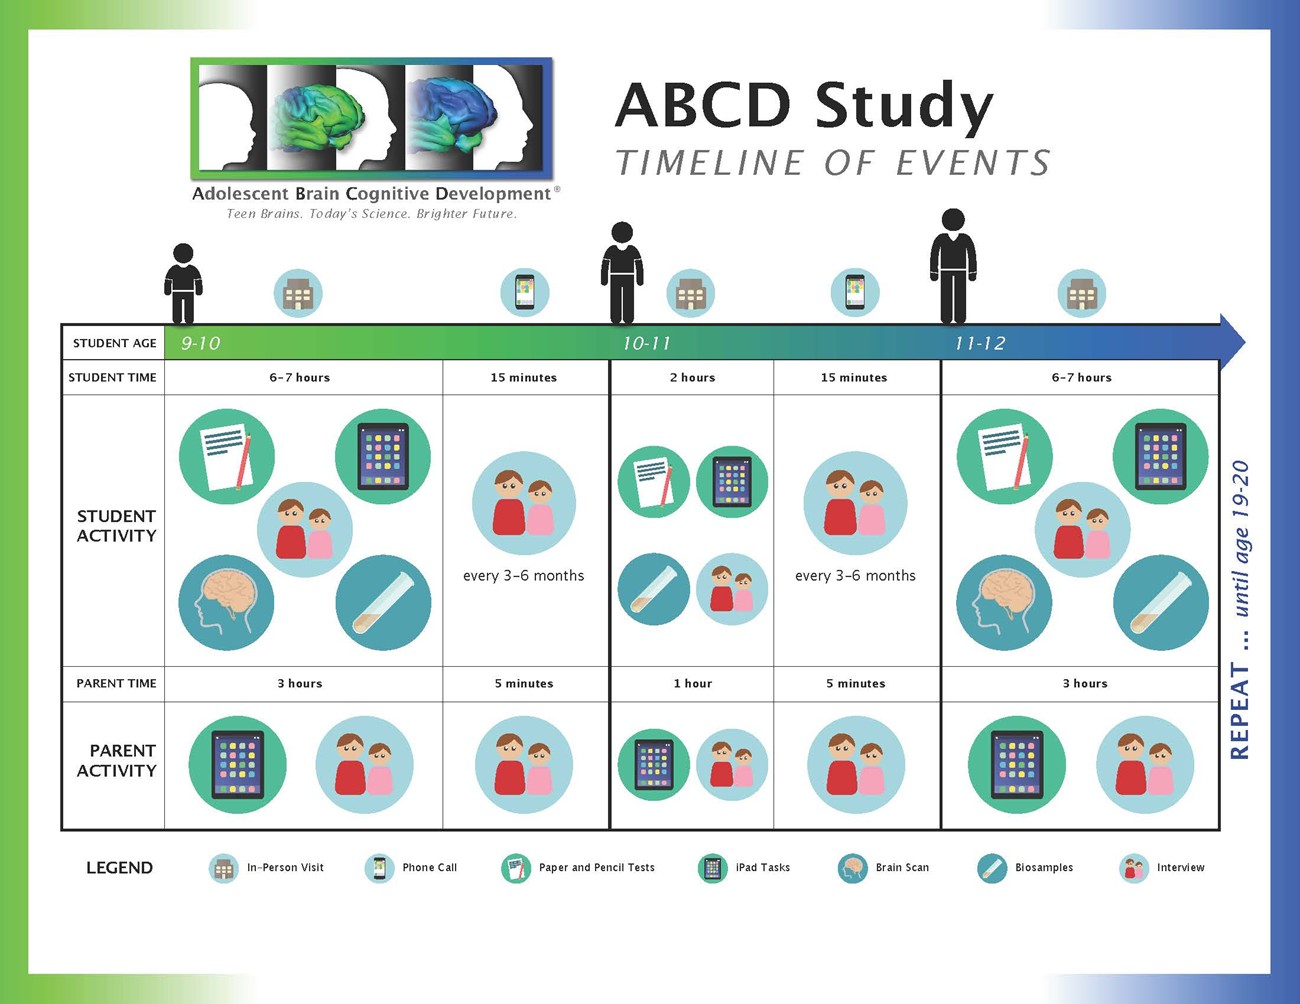
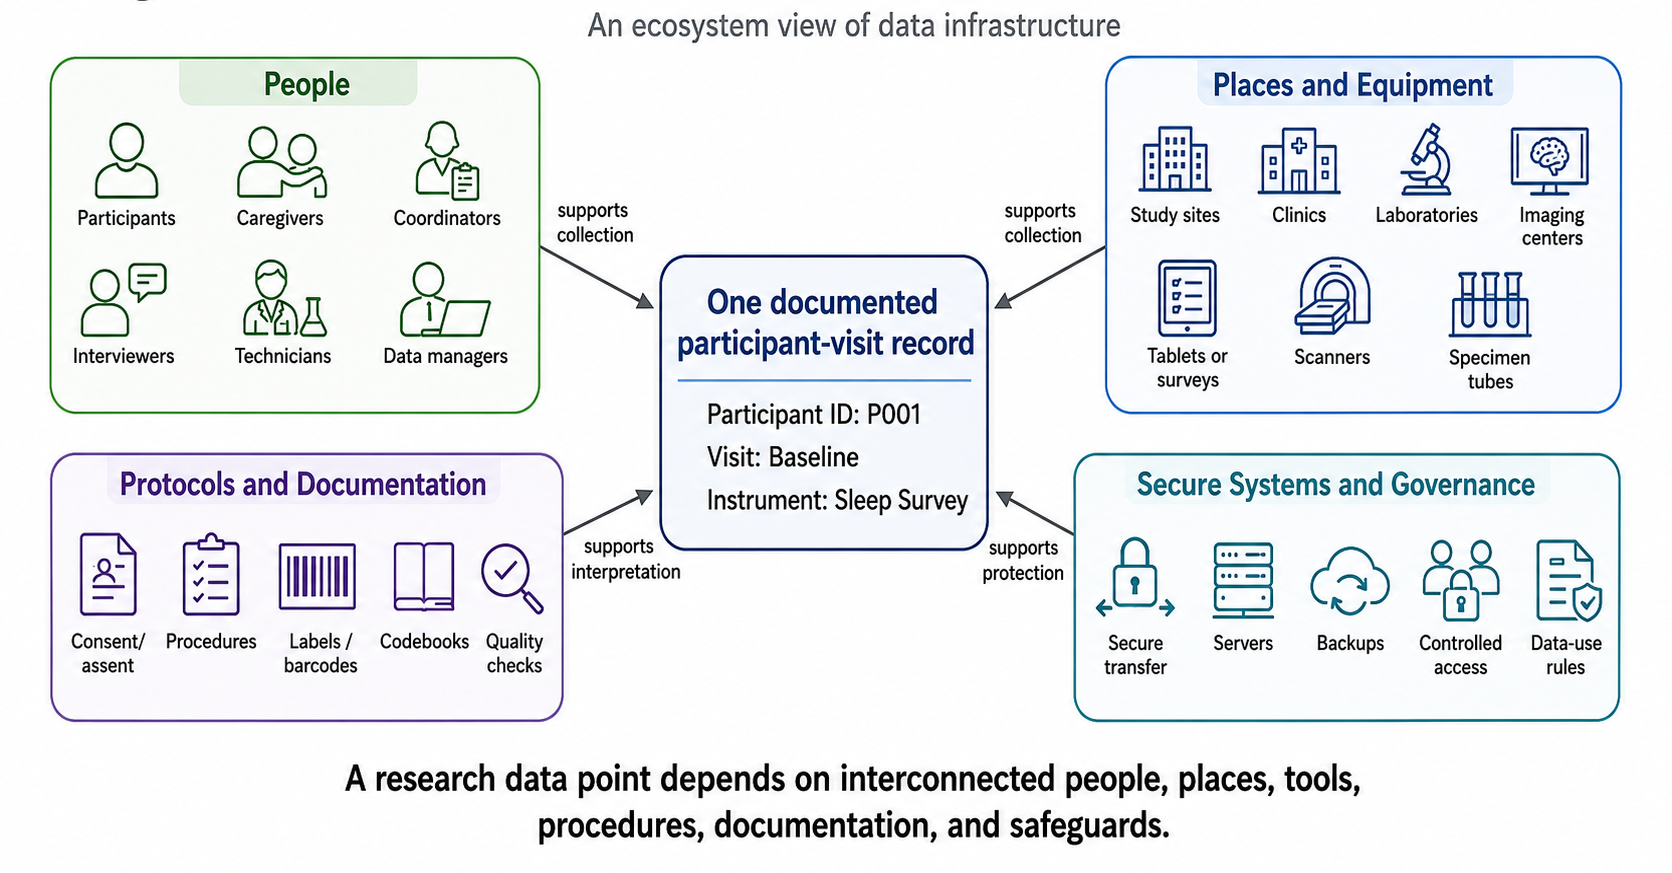
Table 2.1. Example of Turning a Broad Topic into a Study Design
Part of a Study Example Question or Decision
Broad topic Youth development and substance use
Research question How is early adolescent sleep quality related to later cannabis use?
Explanatory variable Sleep quality (e.g., hours of sleep, sleep latency)
Outcome variable Cannabis use frequency (e.g., days used in the past 30 days)
Contextual/demographic variables Age, sex, family income, neighborhood factors
Study design Longitudinal observational study following participants across multiple years
Limitation Observational associations do not imply causation. Other factors, such as stress or peer influences, may confound the relationship.

2.2 Study Designs: Observational and Experimental

A study design describes how a research question will be investigated.

In an experimental design, researchers manipulate an explanatory variable to observe its effect on an outcome. For example, researchers might randomly assign participants to receive either a new medication or a placebo. Randomization helps ensure that differences in outcomes are due to the manipulated variable rather than other factors.

In an observational design, researchers observe natural variation without deliberately changing participants’ experiences or exposures. The ABCD Study is an observational longitudinal study: researchers follow participants over ten years and record naturally occurring experiences and outcomes.

Observational studies can identify associations and developmental trajectories, but they cannot by themselves demonstrate that one variable causes another.

Study designs also differ in whether they collect data at a single time point or across multiple time points.

A cross-sectional study collects data at one point in time.

A longitudinal study collects data across repeated visits, making it possible to examine change over time.

ABCD’s longitudinal design allows researchers to assess how early exposures relate to later outcomes. However, even with longitudinal data, causal interpretations require caution because unmeasured factors may influence both exposures and outcomes.

2.3 Sampling, Recruitment, and Protocols

Research questions are answered using data from a sample, which is a subset of individuals drawn from a larger population.

Sampling involves:

  • defining inclusion and exclusion criteria
  • deciding how many participants are needed
  • determining how participants will be selected

Recruitment refers to the process of inviting eligible individuals to participate and is shaped by ethics, fairness, and feasibility.

In ABCD, recruitment occurs across 21 sites in the United States, with efforts to include participants from diverse backgrounds and communities.

A protocol outlines every procedure that a study will follow, including:

  • how participants are screened
  • how consent or assent is obtained
  • which measures are collected
  • how specimens are handled
  • how data are transferred and stored

Protocols must be approved by Institutional Review Boards (IRBs) and must respect ethical principles such as informed consent, beneficence, and justice.

Longitudinal studies require particular attention to participant follow-up. Participants must be contacted repeatedly, scheduling must accommodate families, and researchers must plan for attrition, which occurs when participants leave a study over time.

In ABCD, participants complete annual study visits along with additional phone check-ins throughout the study period. This schedule is designed to capture developmental changes as participants move through adolescence and into early adulthood.

Sampling and recruitment decisions shape what the data can show. If certain groups are underrepresented, or if some participants drop out at higher rates than others, study findings may not generalize to the broader population.

Figure 1.3 illustrates how the ABCD Study, as a longitudinal study, involves repeated participant and caregiver activities across developmental periods.

ABCD Study timeline infographic showing ages 9–12 with in-person visits and brief phone check-ins every 3–6 months, plus tests, interviews, scans, and biosamples, repeating to ages 19–20.
Figure 1.3. ABCD Data Collection Schedule, Reproduced from https://abcdstudy.org/scientists/

2.4 Association vs. Causation: An Important Caution

It is tempting to interpret associations as evidence that one variable causes another, but such conclusions require careful study design and analysis.

One major challenge is confounding, which occurs when an unmeasured variable influences both the explanatory variable and the outcome. For example, family stress could affect both sleep quality and substance use risk, creating an association between the two even if sleep itself is not causing later substance use.

Researchers attempt to minimize confounding in several ways. They may measure and adjust for potential confounders, use randomization in experiments, or apply statistical methods designed to account for alternative explanations. Many of these approaches will be introduced in later modules.

For now, remember the following principle:

Observational studies can identify important patterns and generate hypotheses, but they do not by themselves establish causation.

Longitudinal studies such as ABCD strengthen researchers’ ability to study temporal ordering and developmental change, but even longitudinal evidence must be interpreted cautiously when making causal claims.

3. The Biomedical Data Journey

3.1 From Research Question to Analytic Dataset

Figure 1.1 introduced the biomedical data journey as a four-stage process. The figure is intentionally simplified. Its purpose is to show that an analytic dataset is not the starting point of research. It is one product of a longer sequence of scientific, technical, and ethical decisions.

The four stages are:

  1. Frame and design the study.
    Researchers identify a question, review prior evidence, define concepts and variables, select a study design, plan recruitment, and create a protocol. They also establish procedures for protecting participants and obtaining ethical approval.
  2. Recruit participants and collect data.
    Staff recruit eligible participants, obtain consent or assent, schedule study activities, and collect information through surveys, interviews, tasks, specimens, health assessments, or imaging procedures.
  3. Process, check, and document the data.
    Raw responses, specimens, images, and task records are processed into usable measurements. Researchers and data managers check data quality, apply scoring rules, record identifiers, document variable definitions, and organize files for secure storage and future use.
  4. Govern, analyze, report, and responsibly reuse data.
    Curated data are stored under access rules. Analysts construct datasets for particular questions, conduct analyses, interpret results, communicate findings, and share approved outputs while protecting participant confidentiality.

These stages are connected. A decision made early in the process can shape every later stage. For example, the wording of a survey question affects what participants understand and report. A change in a laboratory protocol can affect how a biomarker is measured. A missing follow-up visit may limit what researchers can conclude about change over time.

The biomedical data journey is therefore not only a sequence of technical tasks. It is a chain of decisions that affects what the data mean.

3.2 Two Questions Analysts Must Ask

As a student, rather than trying to memorize every possible stage of data collection and processing, you should return to two questions throughout the research process:

  1. What created this information?
  2. What must an analyst know before interpreting it?

The first question directs attention to the people, settings, instruments, and procedures that produced a value. The second question directs attention to documentation and limitations. Before interpreting a variable, an analyst may need to know:

  • who provided the information;
  • when it was collected;
  • which instrument or procedure produced it;
  • what the possible values mean;
  • how missing values, skip patterns, and special codes are represented;
  • whether quality-control procedures flagged a concern;
  • whether the value was transformed, scored, or derived from other variables; and
  • what limits the study design places on interpretation.

These questions help analysts avoid treating all columns as though they were simple, self-explanatory facts.

3.3 An Analytic Dataset Is Constructed, Not Found

An analytic dataset is not usually the same thing as the full study archive.

Large studies may contain thousands of files, repeated visits, multiple reporters, laboratory results, imaging records, quality-control fields, documentation files, and restricted identifiers. To answer a particular question, analysts select relevant variables, determine which observations meet their inclusion criteria, apply documented coding decisions, and create a dataset suitable for a specific analysis.

For example, an analyst studying sleep and later cannabis use might need to:

  • identify the appropriate sleep measure and its scoring rules;
  • identify the relevant cannabis-use measure and assessment window;
  • select the visits needed to establish temporal order;
  • decide how to handle participants with incomplete follow-up data;
  • include demographic or contextual variables that may be relevant to interpretation; and
  • document every decision so that the analysis can be reviewed or reproduced.

The resulting analytic dataset is therefore a carefully constructed representation of the larger study. It reflects both the original study design and the analyst’s documented decisions.

The next section examines the infrastructure that makes this process possible.

4. Physical and Operational Data Infrastructure

4.1 What Is Data Infrastructure?

Data infrastructure is the connected system of people, places, materials, protocols, devices, networks, storage systems, documentation, and access rules that make research data possible.

Infrastructure includes much more than a dataset file or a cloud-storage account. It includes the people who recruit and work with participants, the locations where data are collected, the devices and materials used to produce measurements, the procedures that guide collection, the systems that transfer and store information, and the agreements that determine who may access sensitive data.

A single data point may appear simple in a spreadsheet. For example, a row might show that participant P001 completed a sleep survey at a baseline visit. But that record depends on many connected parts of the research system: a participant and caregiver who agreed to take part, staff who scheduled the visit, a survey instrument, a tablet or web platform, an identifier, documentation describing the measure, quality checks, and secure systems that protect the information.

A concept-map style figure titled “Figure 4.1. What Makes a Biomedical Research Data Point Possible?” At the center is a box labeled “One documented participant-visit record,” with example fields for Participant ID, Visit, and Instrument. Surrounding it are four connected clusters. The first cluster, “People,” includes participants, caregivers, coordinators, interviewers, technicians, and data managers. The second cluster, “Places and Equipment,” includes study sites, clinics, laboratories, imaging centers, tablets or surveys, scanners, and specimen tubes. The third cluster, “Protocols and Documentation,” includes consent or assent, procedures, labels or barcodes, codebooks, and quality checks. The fourth cluster, “Secure Systems and Governance,” includes secure transfer, servers, backups, controlled access, and data-use rules. Lines connect each cluster to the central participant-visit record, showing that a single research data point depends on interconnected people, places, tools, procedures, documentation, and safeguards.
Figure 1.4. What Makes a Biomedical Research Data Point Possible? A documented participant-visit record depends on interconnected people, places and equipment, protocols and documentation, and secure systems and governance.

The purpose of this figure is not to suggest that every data point follows an identical path. Different kinds of information require different systems. A survey response, biological specimen, MRI scan, and cognitive-task score may each involve different equipment, staff expertise, processing steps, and quality checks. However, all depend on an infrastructure that supports both data collection and responsible interpretation.

4.2 People, Places, and Participant Encounters

Biomedical data begin with people.

Participants and, in many studies, their caregivers decide whether to take part. Research coordinators explain study activities, schedule visits, answer questions, maintain contact over time, and help participants navigate the study process. Interviewers administer surveys or conduct structured interviews. Technicians operate specialized equipment. Laboratory staff process specimens. Data managers oversee how information moves through the study and verify that records are organized correctly.

Data collection also occurs in real places. Depending on the study, participants may visit a university research center, clinic, school, hospital, mobile testing site, laboratory, or imaging center. The setting can affect what is feasible, how long an activity takes, how comfortable participants feel, and whether data collection proceeds as planned.

For example, a participant may complete a survey on a tablet during a clinic visit, perform a cognitive task on a computer in a laboratory, provide a saliva sample, or complete an MRI scan at an imaging center. Each activity requires trained staff, available equipment, appropriate scheduling, and procedures designed to protect participants’ privacy and safety.

Recruitment and retention are also part of this infrastructure. Longitudinal studies depend on maintaining contact with participants and families across years. Staff may need to update contact information, schedule flexible appointments, provide reminders, and address barriers to participation. When participants miss visits or leave a study, those events can affect the completeness and representativeness of the data.

Consent and assent are central to this process. For studies involving minors, caregivers typically provide permission and young participants provide assent in developmentally appropriate language. These conversations explain what the study involves, what information will be collected, how privacy will be protected, and that participation is voluntary.

4.3 Instruments, Specimens, Devices, and Identifiers

Research data are produced through instruments and procedures.

A survey instrument may ask participants about sleep, mood, substance use, family relationships, or peer experiences. A behavioral task may record reaction times, accuracy, choices, or patterns of attention. A laboratory assay may measure a substance or biomarker in saliva, blood, urine, or hair. An imaging procedure may generate structural, functional, or diffusion-based information about the brain.

Each tool produces data differently. A survey response reflects how a participant understood and answered a question at a particular time. A specimen result reflects laboratory procedures, equipment calibration, and sample handling. An imaging-derived variable reflects both the original scan and later computational processing.

To link these records correctly, studies use identifiers. These may include:

  • participant identifiers;
  • caregiver or family identifiers;
  • study-site identifiers;
  • visit or event identifiers;
  • instrument identifiers;
  • specimen identifiers;
  • timestamps; and
  • quality-control or processing identifiers.

Identifiers make it possible to connect records across time and across data sources. For example, a participant’s baseline sleep survey, follow-up substance-use report, laboratory result, and imaging record may be stored in different files. Correct identifiers allow those records to be linked when appropriate.

Labels and barcodes are especially important for biospecimens. A specimen tube must be matched to the correct participant, visit, collection date, and processing history. A labeling error can lead to a mismatch that affects later analysis. For this reason, protocols specify how specimens, devices, and digital records must be labeled, transferred, and documented.

4.4 Transfer, Processing, Storage, and Controlled Access

Once information is collected, it must move through systems that protect its accuracy and confidentiality.

Survey data may be transferred through encrypted networks. Imaging files may be uploaded to secure servers. Biological specimens may be shipped to laboratories using temperature-controlled containers and chain-of-custody documentation. In each case, researchers need to know where the information came from, where it has been stored, and what processing occurred before the data became available for analysis.

Processing can involve many steps. Laboratory staff may prepare and assay biological samples. Imaging teams may remove direct identifiers, assess scan quality, and process raw images into research-ready files. Behavioral-task data may be scored using predefined rules. Data managers may merge records, check for inconsistencies, and prepare documentation for future users.

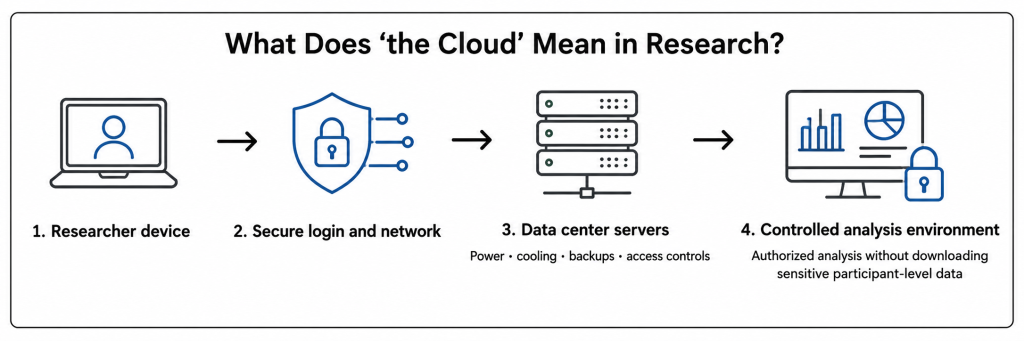
Data are then stored on physical hardware. Even when researchers refer to “the cloud,” data do not float in an abstract digital space. They reside on servers in facilities that require power, cooling, network connections, backups, monitoring, and access controls.

A left-to-right diagram illustrating how cloud-based research data systems operate. The first panel shows a researcher device such as a laptop. An arrow points to a secure login and network connection represented by a shield and lock icon. A second arrow points to physical data-center servers that provide storage, backups, power, cooling, and access controls. A final arrow points to a controlled analysis environment where authorized researchers can analyze data without downloading sensitive participant-level information to personal computers.
Figure 1.5. What “the cloud” means in research. Researchers connect through secure networks to physical data-center servers and authorized analysis environments

Box 4.1. What Does “the Cloud” Mean in Research?

The term cloud is often used as though data exist somewhere outside the physical world. In research, however, cloud services depend on physical servers located in data centers. These facilities require controlled access, power supplies, cooling systems, backups, fire protection, network connections, and continuous monitoring.

An authorized researcher typically connects from a personal or institutional device through a secure login and network. The researcher may then work in an approved analysis environment that provides access to permitted data and software tools. Depending on the data-use terms, sensitive participant-level files may remain inside that environment rather than being downloaded to a personal computer.

The specific technical arrangements differ across studies and repositories. The central idea is consistent: data security is not only a technical feature. It is an ethical responsibility to participants who trusted researchers with personal information.

Controlled access is especially important for sensitive biomedical data. Datasets may include information about health, mental health, substance use, genetics, family relationships, or brain development. Researchers who receive access to controlled data are expected to follow applicable data-use agreements, protect confidentiality, use the data only for authorized purposes, and avoid attempts to identify participants.

4.5 How Infrastructure Shapes Data Quality

Infrastructure affects the quality, completeness, and interpretation of the data that analysts eventually receive.

A missed follow-up visit may produce missing data. A participant may leave a survey incomplete because of time limits, fatigue, discomfort, or technical problems. A specimen may be unavailable, mislabeled, damaged, or unsuitable for processing. A behavioral task may be affected by a software error or device malfunction. An imaging scan may not meet quality standards because of participant movement or equipment problems.

These events do not necessarily indicate that someone acted carelessly. Large longitudinal studies are complex systems that involve many people, locations, schedules, devices, and procedures. However, the events can have analytical consequences.

For example:

  • participants who miss later visits may differ systematically from those who remain in the study;
  • technical failures may occur more often at one site or during one period of data collection;
  • some measures may be unavailable for younger participants, participants with certain conditions, or participants who cannot complete a procedure;
  • quality-control exclusions may reduce the available sample for a particular analysis; and
  • inconsistent labels or identifiers may prevent records from being linked correctly.

For these reasons, analysts need documentation that explains how data were collected, processed, checked, and coded. They also need to distinguish between true missing values, values that are not applicable because of skip logic, values excluded during quality control, and values that are unavailable for other reasons.

Later modules will return to these issues when examining missing data, outliers, data cleaning, and reproducible analytic decisions.

4.6 Infrastructure, Ethics, and Public Trust

Infrastructure is not ethically neutral. Ethical principles are built into the systems that determine how data are collected, labeled, transferred, stored, accessed, analyzed, and eventually deleted.

Respect for persons requires that participants receive understandable information and can make voluntary decisions about participation. Beneficence requires researchers to minimize risks and protect sensitive information. Justice requires attention to who is recruited, who bears the burdens of research, who benefits from research participation, and whether findings are interpreted fairly.

These obligations continue after a participant visit ends. They shape how identifiers are managed, how access is restricted, how results are reported, and how data may be reused by other researchers.

For analysts, the key lesson is straightforward:

Data security, documentation, and responsible access are part of scientific quality. They are also part of the promise researchers make to participants.

5. Digital Data Architecture and Documentation

Research data must be organized so that analysts can identify records, interpret variables, connect information across time, and understand how a dataset was prepared for use. This organization is called data architecture (which in other data science domains can refer to data structures and data systems).

For many analyses, the most visible form of data architecture is a DataFrame. A DataFrame is useful, but it is only one organized view of a larger system of records, identifiers, documentation, and data versions.

5.1 What Does a Row Represent?

Many research datasets are organized as rectangular data: tables with rows and columns. In Python, the pandas library represents these tables as DataFrames.

Each row represents one observation or record. Each column represents one variable. The most important question is:

What does one row represent?

A row may represent one participant, one participant at one visit, one caregiver report, one biological specimen, one imaging scan, or one behavioral-task trial.

For example, a longitudinal study may include one row for each participant at each study visit. In that case, the same participant appears in multiple rows because information was collected at multiple points in time.

The unit represented by a row is called the unit of observation. Analysts must understand this unit before summarizing, comparing, or interpreting data.

5.2 Identifiers, Events, and Longitudinal Records

Large biomedical studies collect information across participants, families, sites, visits, instruments, and procedures. Identifiers allow researchers to connect the right records without relying on names or other direct personal information.

Common identifiers include:

  • participant ID;
  • family or caregiver ID;
  • study-site ID;
  • visit or event ID;
  • instrument or task ID;
  • specimen or imaging-session ID; and
  • date or time stamp.

For example, a participant may complete a sleep survey at baseline, report substance use at a later visit, and provide a biological specimen at another visit. These records may be stored in different files, but shared identifiers can allow researchers to link them appropriately.

In longitudinal research, a baseline visit is the first study measurement. Follow-up visits occur later and allow researchers to examine developmental change over time.

Longitudinal records can be organized in different ways. In Lab 1, you will inspect a simplified participant-visit DataFrame and see how identifiers and visit labels organize repeated observations.

5.3 Documentation: Data Dictionaries, Codebooks, and Metadata

A variable name alone rarely provides enough information for interpretation.

For example, a variable called sleep_q does not tell an analyst whether it represents sleep duration, perceived sleep quality, sleep latency, a youth self-report, a caregiver report, a baseline measure, or a derived score.

Researchers rely on documentation to interpret variables correctly.

A data dictionary describes the variables in a dataset. It may include a variable name, label, definition, unit of measurement, allowable values, and missing-value codes.

A codebook provides broader information about a measure or instrument. It may include survey questions, response options, scoring rules, skip logic, timing, reporter, and procedures for collecting the information.

Metadata is a broader term for information that describes data. Metadata can include variable definitions, file versions, collection dates, instrument names, processing steps, and quality-control information.

Before using a variable, an analyst should know:

  • what it measures;
  • who provided the information;
  • when and how it was collected;
  • what values are possible;
  • how missing or not-applicable values are coded;
  • whether quality-control flags apply; and
  • whether the value was scored, transformed, or derived from other information.

Documentation prevents analysts from treating codes, blanks, or unusual values as though they were ordinary observations.

5.4 Data Versions and Provenance

Research data often exist in several versions or data states.

  1. Raw data are the initial records created during collection, such as survey responses, task output, specimen records, or image files.
  2. Processed data have undergone initial technical or scoring procedures, such as scoring questionnaires, processing laboratory samples, or converting task output into usable measurements.
  3. Curated data have been organized, checked, documented, and prepared for future use. They may include quality flags, standardized names, and release notes.
  4. Derived data include new variables created from existing information, such as a summary score or a change-from-baseline measure.
  5. Analysis-ready data are a documented selection of variables prepared for a particular research question, population, time frame, and analytic plan.

Provenance refers to the documented history of data: where they originated, what processing occurred, which version was used, and how an analytic dataset was constructed.

Understanding data states and provenance helps researchers choose appropriate files, interpret variables accurately, and make their work reproducible.

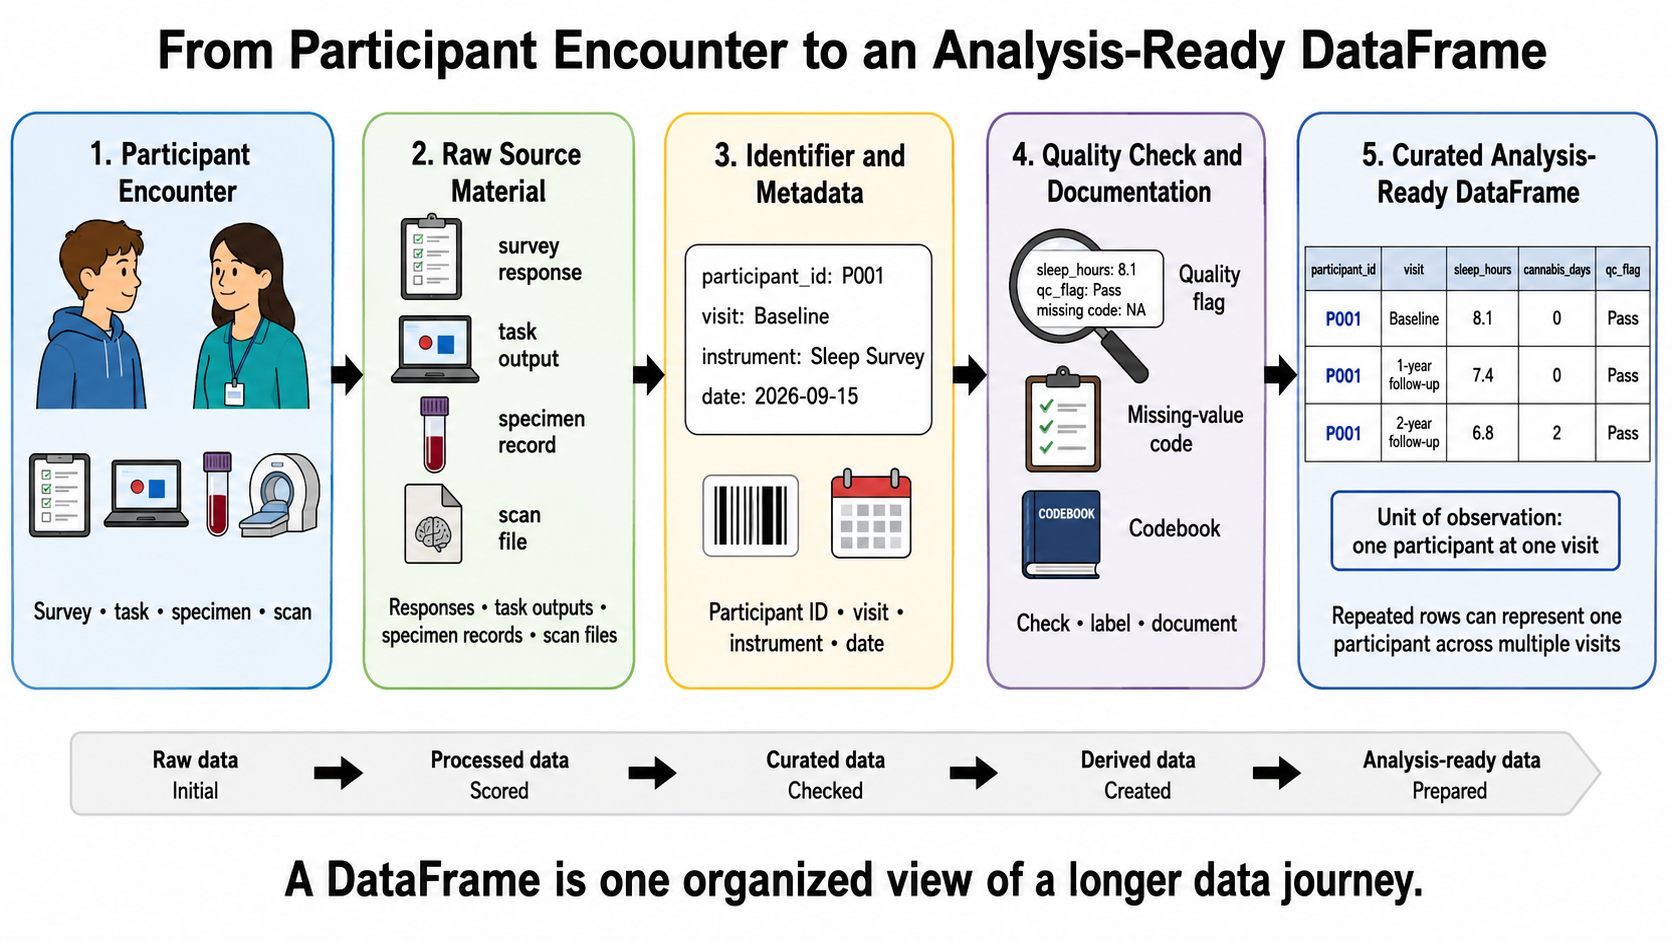
Five-panel diagram showing how research information becomes an analysis-ready DataFrame. A participant encounter produces survey responses, task output, specimen records, or scan files. The information receives a participant ID, visit label, instrument label, and date. Quality checks, missing-value codes, and codebook documentation are applied. The final DataFrame contains rows for one participant across baseline and follow-up visits, with columns for participant ID, visit, sleep hours, cannabis-use days, and quality-control status. A bottom arrow shows the progression from raw to processed, curated, derived, and analysis-ready data.
Figure 1.6. From Participant Encounter to an Analysis-Ready DataFrame.

5.5 Beyond a Single Table

DataFrames are an essential starting point for analysis, but not all biomedical information fits neatly into one table.

Survey responses, demographic information, and many laboratory summaries can often be represented as rows and columns. Other data require different structures:

  • behavioral tasks may produce trial-level or time-series data;
  • wearable devices may generate many time-stamped measurements;
  • brain images are multidimensional arrays of voxels;
  • brain connectivity can be represented as a network; and
  • genetic data may contain information about very large numbers of variants.

Students do not need to master these structures in this module. The key idea is that a DataFrame is one useful representation of biomedical data, not the complete form of every kind of research information.

Data architecture and documentation make it possible to interpret data correctly, trace how records were created, and use sensitive information responsibly.

6. Ethics, Governance, and Responsible Use

6.1 From Data Architecture to Ethics

The technical structures just introduced are not neutral. They exist to protect participants and help analysts interpret data correctly.

A dataset can advance knowledge while still exposing risk if personal information is mishandled. Ethical practice therefore extends across the entire biomedical data journey, from planning a study through collection, processing, storage, analysis, and reuse.

This section connects the Belmont principles and the responsible conduct of research to each stage of that journey.

6.2 Belmont Principles in Data Practice

In the United States, human-subjects research is guided by the Belmont Report, which identifies three core ethical principles (National Commission for the Protection of Human Subjects of Biomedical and Behavioral Research, 1979).

These principles apply not only when recruiting participants, but also when managing and analyzing data.

Table 1.2. Belmont Principles in Data Practice
Belmont Principle Data-Practice Connection
Respect for persons Obtain informed consent or assent by clearly explaining the study’s purpose, procedures, risks, and benefits. Allow participants or their caregivers to decide whether to participate. Honor withdrawal requests. Protect privacy by replacing names with identifiers and limiting access to sensitive information.
Beneficence Maximize benefits and minimize harm. Collect only necessary information and use secure systems to reduce the risk of accidental disclosure. Assess potential risks, including re-identification, stigma, or misuse, and implement safeguards such as encryption and quality checks.
Justice Distribute research burdens and benefits fairly. Ensure that recruitment and consent procedures do not exclude or overburden particular groups. Avoid interpretations that stigmatize participants or attribute differences to inherent biology without considering social context.

These principles are operationalized through regulations and oversight mechanisms such as Institutional Review Boards (IRBs) and the Common Rule, which require studies involving human participants to be reviewed for ethical soundness and risk mitigation (U.S. Department of Health and Human Services, 2018).

6.3 Privacy, Confidentiality, and Re-Identification Risk

Privacy refers to a person’s interest in controlling access to personal information and experiences.

Confidentiality refers to the researcher’s responsibility to protect information entrusted to them.

To respect privacy, researchers remove or replace direct identifiers such as names, addresses, and email addresses with codes. This process, often called de-identification, reduces risk but does not guarantee anonymity.

Re-identification risk arises when a dataset contains enough indirect identifiers, such as age, sex, location, or rare combinations of characteristics, that individuals could potentially be identified by linking information to other sources.

Rich longitudinal datasets such as ABCD often include repeated visits, detailed demographic information, and sometimes genetic or imaging measures. These features increase scientific value, but they can also increase re-identification risk.

Analysts should remember that even datasets described as “de-identified” may still carry privacy risks.

Common strategies for reducing risk include:

  • removing or aggregating sensitive variables;
  • limiting geographic detail;
  • suppressing small cell counts; and
  • controlling access to participant-level files.

Researchers should also avoid sharing intermediate files, screenshots, notes, or outputs that contain potentially identifying information.

6.4 Data-Use Agreements and the ABCD Data Use Certificate

Researchers who access sensitive participant-level data typically agree to a Data-Use Agreement (DUA) or a Data Use Certificate (DUC).

These agreements specify:

  • who may use the data;
  • for what purposes the data may be used;
  • what security procedures must be followed; and
  • how data must be handled when a project concludes.

The ABCD Study shares curated, de-identified data through the National Institute of Mental Health Data Archive (NDA). Researchers seeking access must comply with the applicable terms and conditions established by the archive and their institution.

Typical requirements include:

  • maintaining participant privacy and confidentiality;
  • using data only for approved scientific or educational purposes;
  • implementing appropriate security measures;
  • avoiding attempts to identify participants; and
  • securely deleting or archiving data when a project ends.

Because policies, platforms, and access procedures evolve over time, researchers should always verify current requirements directly with the data repository and their institution before beginning a project.

Most importantly, a data-use agreement is not simply paperwork. It formalizes ethical obligations between researchers and participants.

When researchers agree to a DUA or DUC, they commit to protecting privacy, maintaining security, using data responsibly, and honoring the trust participants placed in the research enterprise.

A Data-Use Certificate Is a Responsibility, Not Just Permission

Researchers may:

  • analyze approved data for approved scholarly purposes;
  • work within authorized analysis environments;
  • report findings responsibly while protecting confidentiality.

Researchers may not:

  • share restricted data with unauthorized individuals;
  • attempt to identify participants using combinations of variables;
  • use data outside the approved project without additional authorization.

When a project ends, researchers must follow the retention, archival, or secure-deletion procedures specified by the relevant agreement.

A Data Use Certificate is a continuing set of responsibilities, not a one-time administrative hurdle.

(National Institute of Mental Health Data Archive, n.d.)

6.5 Controlled Access, Secure Storage, and Secure Deletion

Earlier sections emphasized that “the cloud” refers to physical servers housed in data centers with power, cooling, backups, and access controls.

Sensitive data should be stored on approved systems rather than personal laptops or consumer cloud-storage services.

Controlled access means that only authorized researchers working on approved projects may use participant-level information. Account sharing is prohibited.

Many institutions provide secure virtual workspaces that allow researchers to use statistical software and computational resources while limiting direct access to sensitive files.

Secure deletion is equally important.

At the end of a project, researchers must either securely delete local files or transfer them into approved archives according to the terms of the relevant data-use agreement.

Failing to manage copies responsibly can violate agreements and undermine participant trust.

6.6 Race and Ethnicity: Variables with Social Meaning

Many datasets include race and ethnicity variables.

These variables capture socially meaningful identities and the effects of historical and contemporary social conditions, including discrimination, segregation, structural inequality, and differences in access to resources.

They should not be interpreted as measures of inherent biological differences or as explanations for behavior by themselves.

Responsible analysis requires understanding:

  • how the variable was collected;
  • how categories were defined;
  • how responses were coded; and
  • what social processes may contribute to observed differences.

Analysts should consider whether observed differences may reflect social environments, opportunities, discrimination, health-care access, or other contextual factors rather than inherent traits.

When reporting results:

  • use person-first language;
  • avoid stigmatizing terminology;
  • interpret findings cautiously; and
  • acknowledge relevant social and historical context.

Researchers should also exercise caution when reporting results for very small groups because small cell sizes can increase re-identification risk.

6.7 Responsible Reporting, Citation, and Acknowledgment

Ethical responsibilities continue after analyses are complete.

Responsible reporting includes:

  • citing datasets, instruments, codebooks, and documentation appropriately;
  • acknowledging participants, institutions, and funders who made the work possible;
  • describing limitations in study design, measurement, and interpretation;
  • avoiding causal claims that exceed what the study design supports;
  • using non-stigmatizing language; and
  • sharing only materials that are permitted under the applicable data-use agreement.

Researchers should refer to people as participants or people who use substances, rather than defining individuals by a condition or behavior.

When sharing code or reproducible workflows, researchers should ensure that notebooks, examples, and synthetic datasets do not contain sensitive participant information.

7. Reproducible Computational Workflows

7.1 Why Reproducibility Matters

In science, a result becomes more credible when another researcher can follow the same documented steps and obtain the same output from the same data.

Computational reproducibility means that a researcher, collaborator, or future version of yourself can rerun an analysis and reproduce its tables, figures, and results.

Reproducibility does not guarantee that a result is correct, important, or generalizable. It means that the work is transparent enough to be inspected, questioned, and re-examined.

Reproducibility differs from replication. Replication involves collecting or analyzing new data to determine whether a finding appears again. This module focuses on the earlier goal of making one analysis clear, organized, and repeatable.

7.2 Notebooks as Records of Analytic Decisions

This course uses Jupyter notebooks in GitHub Codespaces to support reproducible computational work.

A notebook combines:

  • code cells, which run Python commands; and
  • Markdown cells, which explain reasoning, decisions, and interpretations.

A well-organized notebook records more than code. It documents what data were used, which variables were selected, how values were interpreted, what changes were made, and what outputs were produced.

A reproducible notebook should be able to run from beginning to end using its recorded code. This makes it easier for someone else to understand the analysis and easier for the original analyst to revisit the work later.

7.3 Notebooks, Provenance, and the Data Journey

Earlier sections introduced provenance as the history of a dataset before analysis: where the data originated, what processing occurred, and which version was used.

A notebook continues that history.

It records what the analyst did after receiving the data, including selecting variables, creating derived measures, filtering records, handling missing values, recoding categories, and producing tables or figures.

Together, provenance and reproducible notebooks allow researchers to trace a result from an analytic output back through the decisions, documentation, and source records that made the analysis possible.

7.4 Synthetic Data for Learning

To practice coding and analysis without exposing sensitive participant information, this course uses synthetic datasets.

Synthetic data are created to resemble selected structures or statistical patterns of a real study. They may include realistic-looking variable names, data types, identifiers, distributions, missing-value codes, and quality-control flags. However, no synthetic record corresponds to an actual participant.

Using synthetic data allows students to practice DataFrame operations, documentation, and reproducible workflows while protecting the confidentiality of research participants.

Synthetic datasets are designed for learning. Students should not use them to make substantive claims about real patterns of substance use, brain development, or health outcomes.

In later modules, ABCD remains an important scientific and methodological example, while students continue to develop skills using appropriately designed synthetic data.

8. Looking Ahead

Module 2 focuses on measurement and instrumentation. You will examine how abstract concepts such as substance use, stress, social support, and mental health become measurable variables through surveys, interviews, tasks, and toxicology measures. You will also begin using descriptive summaries and visualizations to examine survey and toxicology data.

Module 3 focuses on data quality and preparation for analysis. You will examine how missing values, quality-control flags, inconsistencies, and linked longitudinal records affect interpretation. You will also begin tracing how source records become a documented, analysis-ready dataset.


References

Adolescent Brain Cognitive Development Study. (n.d.). Scientists. Retrieved July 2, 2026, from https://abcdstudy.org/scientists/

Jernigan, T. L., & Brown, S. A. (2018). Introduction. Developmental Cognitive Neuroscience, 32, 1–3. https://doi.org/10.1016/j.dcn.2018.05.002

National Commission for the Protection of Human Subjects of Biomedical and Behavioral Research. (1979). The Belmont report: Ethical principles and guidelines for the protection of human subjects of research. U.S. Department of Health, Education, and Welfare.

National Institute of Mental Health Data Archive. (n.d.). Data use certification. Retrieved July 2, 2026, from https://nda.nih.gov/about/policies

U.S. Department of Health and Human Services. (2018). Basic HHS policy for protection of human research subjects (45 C.F.R. pt. 46). https://www.hhs.gov/ohrp/regulations-and-policy/regulations/45-cfr-46/index.html

United States Department of Education. (n.d.). Say “no” to crack and other drugs [Poster]. National Library of Medicine, History of Medicine Division. Wikimedia Commons.

License

Icon for the Creative Commons Attribution 4.0 International License

Data Science & Addiction Research Methods Copyright © by Jesse Liss is licensed under a Creative Commons Attribution 4.0 International License, except where otherwise noted.