
7 Chapter 7: Instrumentation
Learning Objectives:
- Understand the concept of instrumentation in health research and its importance in collecting reliable and valid data.
- Identify different types of instruments used in health studies, including surveys, biological measures, medical imaging, and genetic tests.
- Discuss the challenges of operationalizing complex constructs and strategies to address these challenges.
- Explain the significance of reliability and validity in instrumentation.
- Recognize practical considerations in instrument selection, including cost, accessibility, and population-specific factors.
- Articulate instrumentation in the ABCD study.
Key Terms:
- Instrumentation: The tools, methods, and techniques used to measure, assess, and collect data on health-related variables.
- Operationalization: The process of defining concepts in measurable terms.
- Measurement: The process of assigning quantitative or qualitative values to variables based on the data collected through instrumentation.
- Reliability: The consistency or repeatability of measurements obtained with an instrument (e.g., reproducibility).
- Validity: The degree to which an instrument measures what it is intended to measure (e.g., accuracy).
Introduction
In Chapter 2 we discussed research questions and hypotheses as formed with variables, which are concepts that can be measured, such as, blood glucose or depression. Instrumentation is about how variables are measured. Instrumentation in health studies refers to the tools, methods, and techniques used to measure, assess, and collect data on health-related variables. Instrumentation thereby is the means that researchers gather reliable and valid data to answer research questions and test hypotheses about health and disease.
Instrumentation vs Operationalization vs Measurement
Before exploring common instrumentation in health research, it is necessary to distinguish among closely related concepts of instrumentation, operationalization, and measurement.
- Instrumentation: Refers to the tools, devices, or procedures used to collect data in a study. Examples include questionnaires, surveys, laboratory blood testing, medical devices, and continuous glucose monitors. Instrumentation focuses on the selection and development of these tools and how they are used to gather information on variables of interest.
- Operationalization: The process of defining complex concepts or constructs in measurable terms, making them quantifiable and observable in research. It involves breaking down abstract concepts into specific, measurable indicators that can be assessed using the chosen instruments. Operationalization ensures that researchers have a clear and consistent understanding of what is being measured and how it is measured (Eisend and Kuss 2019).
- Measurement: Involves the process of assigning quantitative (numerical) or qualitative (categorical) values to variables based on the data collected through instrumentation. It is concerned with how data gathered through instruments are recorded, scaled, and analyzed to produce meaningful information.
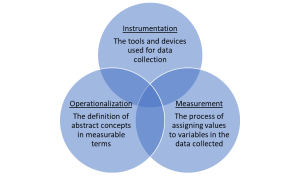
Figure 7: Overlaps Among Instrumentation, Operationalization, and Measurement
Figure 7 presents these concepts in a Venn Diagram. The overlap of operationalization and instrumentation represents that the operationalization of concepts guides the selection of appropriate instruments. For example, the operationalization of “physical fitness” determines whether a treadmill test or a questionnaire is used (instrumentation). The overlap between instrumentation and measurement illustrates that instrumentation provides the means for measurement. For example, a questionnaire (instrumentation) is used to measure attitudes or beliefs (measurement). The overlap between measurement and operationalization highlights that measurement is based on the operational definitions of constructs. For instance, the operationalization of “anxiety” defines how it will be measured. The central overlap represents the integration of all three concepts in research. For instance, the concept of “stress” is operationalized into measurable components, measured using specific scales or questionnaires (instrumentation), and the data collected are then quantified (measurement).
Levels of Measurement
When data is collected in tabular form, meaning the data can be entered into tables, then researchers need to be clear about the level of measurement of data. Each level of measurement — nominal, ordinal, interval, and continuous — has distinct characteristics and implications for how data are analyzed and interpreted. This section will help you identify and apply these levels appropriately in your research, ensuring that your data collection aligns accurately with your study objectives.
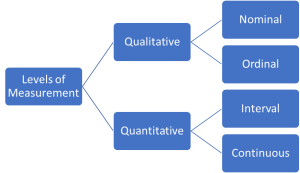
Figure 8: Levels of Measurement for Tabular Data
Nominal Measurement
- Definition: Data is categorized without any order or ranking. Variables measured on a nominal scale are used for labeling variables, without any quantitative value.
- Example: Blood type (A, B, AB, O), Gender (male, female), or Marital status (single, married, divorced).
Ordinal Measurement
- Definition: Data is ranked or ordered, but the intervals between the values are not necessarily equal or known. This type of measurement tells us about the order of values but nothing about the value difference between each one.
- Example: Stages of cancer (Stage I, II, III, IV), where each stage represents a more advanced level of disease progression. A different example is the pain scale used in medical settings, where patients rate their pain on a scale from 0 (no pain) to 10 (worst possible pain). This scale orders the levels of pain in increasing severity but does not specify the exact difference in pain between the points, which is characteristic of ordinal scales.
Interval Measurement
- Definition: Data is in quantitative scales in which both the order and the exact differences between the values are meaningful. However, interval scales do not have a true zero point (a point where the variable does not exist).
- Example: Temperature in Celsius or Fahrenheit, where the difference between each degree is the same, but there is no absence of temperature (zero does not mean ‘no temperature’). Another example is the pH scale used to measure the acidity or alkalinity of gastric acid. The pH scale ranges typically from 1 to 14, with each unit step (e.g., from 6 to 7) representing a tenfold difference in acidity or alkalinity. This scale does not have a true zero (a pH of 0 does not mean ‘no acidity’); rather, it measures the concentration of hydrogen ions in a solution.
Continuous Measurement
- Definition: Continuous (or ratio) measurement scales are similar to interval scales, but they have a meaningful zero point, indicating the absence of the variable being measured. These scales allow for a wide range of quantitative and statistical operations.
- Example: Height, Weight, Age, where zero has meaning (e.g., zero height, zero weight).
Operationalizing Simple vs Complex Concepts
Before understanding common instruments, the last prerequisite information is the distinction between simple vs complex measures (i.e., operationalizing simple vs complex concepts). An easy distinction is the number of measurements taken to operationalize a concept. For example, family income is a simple measure as the concept has only one measure – a family’s total annual income. However, family socioeconomic status (SES) is a complex concept, as SES is a combination of multiple measures, typically, family education, occupation, wealth (note the distinction between wealth and income), and perhaps neighborhood wealth, among others.
Major controversies in health researchers arise from the selection of instruments to operationalize complex concepts, such as psychological states, social context and environments, and multifaceted health conditions. This process involves defining these concepts in measurable terms, which can pose significant challenges (Diener, Oishi et al. 2003).
Challenges in Operationalizing Complex Constructs:
- Subjectivity: Constructs like well-being or anxiety are inherently subjective, varying significantly across individuals and cultures. This makes it challenging to develop universally applicable measures.
- Multidimensionality: Many constructs are multidimensional, encompassing various components that need to be individually measured. For instance, addiction might include physical dependence, psychological craving, and social consequences.
- Dynamic Nature: Constructs such as mental health states can change over time, requiring measures that can capture these fluctuations.
Strategies for Addressing These Challenges:
- Developing Clear Definitions: The first step is to clearly define the construct, breaking it down into its constituent parts. For happiness, this might involve distinguishing between short-term emotional states and long-term life satisfaction.
- Creating Valid and Reliable Instruments: Developing or selecting instruments that have been validated and shown to be reliable in measuring the construct is essential, which is further discussed a following section.
- Employing Multiple Measures and/or Mixed Methods: Using a combination of self-reports, observational methods, and physiological measures can provide a more comprehensive assessment. In studying addiction, researchers might combine self-reported questionnaires with clinical interviews and biological markers.
- Longitudinal Studies: Conducting studies over time can help capture the dynamic nature of certain constructs, providing insights into how they evolve and what factors influence changes.
- Cross-Cultural Validation: Ensuring that measures are validated across different cultural contexts is essential for constructs that may be interpreted differently across societies, such as happiness or well-being.
Summary Scores: Integrating Multiple Measurements
After defining a complex construct and before instrument development, consider how individual responses or data points can be integrated to form a summary score. Summary scores combine multiple indicators to provide a holistic measure of a construct, capturing its complexity more effectively than any single indicator. By consolidating data into a single score, researchers can simplify the statistical analysis and interpretation of results. Additionally, aggregating multiple measurements can enhance the reliability of the data by reducing the noise associated with individual measurements.
Summary scores are typically developed by first identifying which components of a construct are essential and how they can be quantitatively represented. For example, measuring anxiety might involve combining scores from different symptoms such as nervousness, restlessness, and irritability. In some cases, certain measures are given greater weight then others, such decisions should be based on theoretical considerations or empirical evidence about the components’ relative importance. Finally, summary scores have a calculation method – researchers determine how to aggregate the components into a single score. Common methods include summing (adding scores), averaging, or using more complex statistical techniques like factor analysis, depending on the nature of the data and the level of measurement. Finally, the calculation method will determine the level of measurement of the summary score, outlined in Table 5.
|
Table 5: Summary Score Calculation Methods & Levels of Measurement |
|||
|
Summary Score Calculation Method |
Level of Measurement |
Explanation |
Example |
|
Sum |
Interval, Nominal, or Ordinal |
Summing scores assumes equal intervals between score points but does not imply a true zero |
Summing scores from a psychological questionnaire. |
|
Weighted Sum |
Interval, Nominal, or Ordinal |
Like summing, but with different weights assigned to each component based on their importance |
Weighting different aspects from a psychological questionnaire. |
|
Average |
Continuous |
Calculating the mean of measurements, which allows for fractional results |
Taking the mean score from a series of psychological tasks. |
|
Factor Analysis |
Continuous |
This statistical method identifies underlying relationships between data points, resulting in factor scores that represent data on a continuous scale. |
Analyzing multiple variables to determine underlying factors in a psychological test. |
Examples of Operationalizing Complex Concepts
- Resilience is the capacity to recover quickly from difficulties. It can be operationalized using instruments like the Connor-Davidson Resilience Scale (CD-RISC), which measures multiple facets of resilience including personal competence, tolerance of negative emotions, and positive acceptance of change. To create a summary score, responses from these various facets are aggregated. This could involve averaging the scores or calculating a weighted sum based on the relative importance of each facet as determined by empirical research. Additionally, observational studies or qualitative interviews can be used to gather narrative data that supports and enriches the quantitative summary scores, providing a multidimensional view of resilience as demonstrated in real-life contexts.
- Social support, encompassing both the perceived and actual assistance received from others, can be quantitatively assessed using instruments like the Social Support Questionnaire (SSQ). The SSQ measures different dimensions of social support such as the number of supportive relationships and the subjective quality of these relationships. To derive a summary score, researchers could average the scores across these dimensions or use factor analysis to create a composite score that reflects the overall level of social support. Network analysis can also complement this by visually mapping out the structure of an individual’s social network, thus providing quantitative and visual summary data on the density and interconnectedness of support networks. This holistic approach allows for a deeper understanding of how social support structures are formed and maintained.
Common Types of Instrumentation in Health Studies
With an understanding that instruments are tools for data collection, which allows for operationalization and measurement of variables, this section provides an overview of common instruments used in health research.
Survey Instruments
Scales: A central feature in surveys, scales are designed to measure various health-related aspects quantitatively (Streiner, Norman et al. 2024). There are many types:
- Unipolar and Bipolar Scales: Unipolar scales measure one trait, such as satisfaction, from not at all to very much so. Bipolar scales gauge two opposite dimensions.
- Nominal Scales: These categorize data without a specific order, like blood type.
- Ordinal Scales: They rank data while not measuring the exact difference between ranks, such as stages of cancer.
- Interval Scales: These measure the distance between responses, like on a depression severity scale, without a true zero point.
- Ratio Scales: These have a true zero point and measure the distance between points, as with height or weight.
- Rating Scale: A tool that captures the degree of agreement or disagreement with health-related statements. For instance, it could assess how much a patient agrees that a medication alleviates symptoms.
- Likert Scale: This common scale in health research measures attitudes or perceptions on health topics. Participants may be asked to rate from ‘strongly disagree’ to ‘strongly agree’ on statements regarding their well-being post-treatment.
Psychometric Tests: These tests are designed to quantitatively measure cognitive functions, aptitudes, and personality traits that have implications for health. They are instrumental in mental health research, aiding in the diagnosis and understanding of psychological conditions. For example, the Beck Depression Inventory might be used by psychologists to assess the severity of depressive symptoms in patients.
Nutritional Assessments: These are crucial for gauging dietary habits, nutritional status, and food security, often using food frequency questionnaires or 24-hour dietary recalls, particularly in fields like nutritional epidemiology.
Checklists: This is a targeted approach to gather data on specific health aspects systematically. It’s particularly useful in clinical settings to monitor patient symptoms or treatment adherence. In clinical settings, a checklist could be used to ensure that patients with chronic conditions like diabetes have received all necessary screenings and vaccinations.
Questionnaires: A versatile instrument, questionnaires are structured to collect information on health behaviors, risk factors, and disease prevalence. They are constructed as a series of questions on health-related behaviors, risk factors, and disease prevalence. A typical example is a lifestyle questionnaire used in a large-scale epidemiological study, where participants might be asked about their diet, exercise habits, and smoking status to correlate these behaviors with health outcomes.
Question Design
Survey instruments are designed with a range of considerations (Streiner, Norman et al. 2024). Often, particularly in scales, multiple questions aim to capture various facets of a single variable to ensure a comprehensive understanding. The choice of scale—whether Likert or visual analog—depends on the desired specificity and the nature of the variable. The sequencing of questions is methodically planned to gather new information or corroborate previous responses, with response options crafted to avoid introducing bias. How the survey is administered — online, by phone, or in-person — will depend on the study’s context and participant accessibility. Piloting the survey before full deployment helps refine questions and structure for clarity and effectiveness. Selecting the right survey instrument is crucial to effectively answer the research question. Matching the instrument to the measurement ensures the data collected will directly contribute to testing the hypothesis or exploring the research question at hand.
Biological & Physiological Measures
Biological and physiological measures proxy the state of functioning and condition of the human body. Biometric devices, laboratory tests, and an array of other tools are utilized to directly measure health outcomes. Such instruments provide objective data that form the cornerstone of medical practice and research. These clinician-reported measures guide clinical decisions for diagnosis, monitoring, and treatment.
Laboratory tests, such as blood tests, can provide numerous measures of a research participant’s health, revealing information about conditions like anemia, infections, and diabetes. For example, a complete blood count (CBC) is a commonly administered test that measures different components of the blood, including red and white blood cells, platelets, hemoglobin, and hematocrit, providing necessary data for diagnosing a wide range of conditions. Similarly, blood chemistry panels, including lipid profiles and liver function tests, give valuable insights into metabolic processes and organ function. Beyond bloodwork, other bodily samples like urine, saliva, or tissues are often collected and analyzed in a lab setting. Urinalysis can detect kidney disease or track the progression of diabetes, while saliva tests may measure stress responses through cortisol levels. Biopsies of tissue are crucial in oncology to identify and classify cancer types. There are a range of other tools for assessing various bodily functions, such as spirometers for assessing lung function.
Medical Imaging & Neuroimaging
Medical imaging scans and neuroimaging are another large area instrumentation in health research. Medical imaging encompasses a range of technologies that visualize the structures and activities within the body, often aiding in diagnosis, treatment planning, and research. Computed Tomography (CT) scans use X-rays to create detailed cross-sectional images of the body. Magnetic Resonance Imaging (MRI) employs powerful magnets and radio waves to generate detailed images of organs and tissues. They are particularly adept at imaging non-bony parts or soft tissues of the body, such as the brain, spinal cord, and nerves, as well as muscles and ligaments. Positron Emission Tomography (PET) scans show metabolic processes in the body by detecting radiation emitted by a radioactive substance injected into the body. This is especially useful in detecting cancer, monitoring response to therapy, and studying brain and heart function.
Neuroimaging techniques like MRI and PET scans are not only diagnostic tools but also vital instruments for health research. They provide invaluable data on the brain’s structure and function, supporting the understanding of neurological diseases, mental health conditions, and the neural underpinnings of behavior. fMRI is a specialized MRI that measures and maps the brain’s activity. Unlike a standard MRI, which provides static images, fMRI captures changes in blood flow to different brain areas, offering a dynamic view of brain activity during specific tasks or in response to stimuli. The application of fMRI has been particularly transformative in cognitive neuroscience and psychology. It allows researchers to observe which brain regions are involved in cognitive processes like memory, attention, and language. In mental health research, fMRI helps to elucidate the brain function alterations associated with disorders like depression, schizophrenia, and anxiety, paving the way for more targeted and effective treatments.
Social & Environmental Assessments
Social and environmental assessments help us to understand the broader context in which individual health outcomes are situated. A range of social determinants of health data identifies non-medical factors that impact health outcomes. These determinants include aspects such as socioeconomic status, education, neighborhood and physical environment, employment, and social support networks, as well as access to healthcare. Researchers and clinicians gather this data through surveys, interviews, and by examining community-level statistics to understand the social context of a patient’s health and well-being.
Instruments designed to measure environmental factors provide quantifiable data on elements that can significantly impact health. Air quality monitors assess air pollution levels, identifying potential health hazards such as high concentrations of particulate matter, nitrogen dioxide, or other pollutants, such as areas with high traffic. Water quality tests can detect a range of contaminants, including bacteria, lead, and pesticides. Noise meters measure sound levels in the environment, which has been linked to various health issues, including hearing loss, sleep disturbances, and even increased risk for heart disease.
Electronic Health Records
Electronic health records (EHRs) are digital versions of patients’ paper charts and encompass a wide range of data types, from demographics to clinical history, laboratory test results, radiology images, treatment information, and billing data. These records facilitate the integration and sharing of patient information across different healthcare settings. In research, EHRs are a rich data source for epidemiological studies, quality improvement projects, and population health management. However, EHRs also present challenges in terms of data quality, standardization, and privacy. Inconsistencies in data entry, variations in how data is recorded across different systems, and the need to protect patient confidentiality all require careful consideration in research.
Wearables
Wearable technology has revolutionized health monitoring, providing both patients and clinicians with real-time data on a variety of physiological and behavioral parameters. Blood pressure monitors and glucose meters (e.g., continuous glucose monitors) have been widely adopted in clinical settings, home use, and for health research. Blood pressure monitors can detect fluctuations throughout the day, helping to identify patterns that might go unnoticed during occasional clinical visits. Glucose meters play a critical role in diabetes management, giving patients the ability to monitor their blood sugar levels multiple times a day and adjust their diet, exercise, and medication accordingly.
Other devices are particularly adept at monitoring physical activity and sleep patterns, offering insights into daily health behaviors that are otherwise difficult to capture. Modern wearables can track the number of steps taken, calories burned, sleep quality, and duration, and even provide sedentary reminders. For example, a smartwatch equipped with a heart rate monitor not only informs an individual about their cardiovascular status during exercise but can also detect abnormalities that may warrant medical attention.
Genetic Tests
Genetic tests analyze DNA sequences to identify genetic variations that may influence an individual’s risk of developing certain conditions or diseases. These tests, which analyze DNA, RNA, chromosomes, proteins, and certain metabolites, help to detect genetic disorders, understand genetic predispositions to various diseases, and inform personalized treatment plans. In health research, genetic testing can pinpoint specific genes or mutations that increase an individual’s risk for developing certain conditions. This information is invaluable in research aimed at understanding the genetic basis of diseases, such as cancer, cardiovascular diseases, and diabetes. For example, research into the BRCA1 and BRCA2 gene mutations has not only advanced our understanding of breast and ovarian cancer risks but also guided the development of targeted therapies and preventive measures. Genetic tests also serve as instruments in research on precision medicine and preventive health strategies. By leveraging these tests, researchers gain insights into the complex interactions between genes and the environment.
Qualitative Instruments
Qualitative instruments derived from interviews, participant observation, and focus groups, are used to explore complex social and psychological phenomena that quantitative measures may not fully capture. These instruments allow for the collection of rich, descriptive data that can provide deeper insights into a participant’s patient experiences, beliefs, attitudes, and behaviors (Saldana 2011).
- Interviews: The development of an interview guide or protocol is a critical aspect of instrumentation in qualitative interviews. This guide outlines the questions or prompts to be used during the interview, ensuring that the conversation remains focused on the research topic while allowing for the exploration of emergent themes. The design of the interview guide requires a deep understanding of the research question and the ability to craft open-ended questions that elicit detailed responses.
- Participant Observations: In participant observations, the instrumentation process involves defining the scope of observation, the roles of the researcher, and the methods for recording observations. This might include developing a coding scheme for field notes or deciding on the use of audio or video recordings. The aim is to capture the nuances of social interactions and behaviors in their natural setting.
- Focus Group Discussions: For focus group discussions, instrumentation includes the creation of a discussion guide that outlines the key topics and questions to be addressed. It also involves decisions about the composition of the group, the setting of the discussion, and the strategies for facilitating interaction and dialogue among participants.
Validity & Reliability in Instrumentation
In health research, instruments must be valid and reliable (Kimberlin and Winterstein 2008). Reliability refers to the consistency or repeatability of an instrument’s measurements. If the same test is repeated under identical conditions, it should yield the same results. For instance, a reliable blood pressure monitor will give consistent readings for a patient in the same state of rest. Validity, on the other hand, measures the accuracy of the instrument — does it measure what it claims to measure? A valid depression screening tool, for example, will accurately identify patients who are depressed and differentiate them from those who are not.
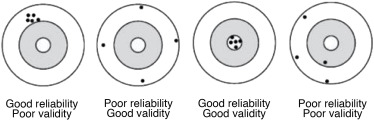
Figure 9: Reliability vs Validity. Image Credit: D.M. González de la Cuesta, 2021.
Figure 9 compares validity and reliability in research measurements. From left to right, in “good reliability, poor validity,” the group of dots (representing measurement results) is tightly clustered, indicating consistent or reliable measurements. However, they are not centered around the bullseye, which means they do not accurately measure what they aim to, thus showing poor validity. In “poor reliability, good validity,” the dots are not closely clustered, suggesting the measurements are not consistent or reliable. They are, however, centered around the bullseye, indicating the measurements are on average accurate or valid. In “good reliability, good validity,” the dots are tightly clustered and centered around the bullseye, indicating that the measurements are both reliable (consistent) and valid (accurate). In “poor reliability, poor validity,” the dots are neither clustered nor centered around the bullseye, indicating the measurements are neither reliable (consistent) nor valid (accurate).
There are several assessments of reliability, including:
- Test-retest reliability assesses the instrument’s stability over time, ensuring consistent results in repeated trials.
- Inter-rater reliability gauges the consistency of measurements when different observers or raters use the same instrument, crucial for subjective assessments.
- Internal consistency looks at how well the individual questions or items of a test that are intended to measure the same construct yield similar results.
Similarly, there are a few evaluation metrics of validity:
- Content validity examines if the instrument fully represents the concept it aims to measure.
- Criterion validity compares the instrument’s measures to a separate, external standard or criterion.
- Construct validity assesses how well the instrument measures the theoretical construct it is intended to measure, which is vital in the case of psychological and social constructs not directly observable.
In choosing instruments for research projects, researchers often prefer published ones that have been rigorously tested for reliability and validity. This not only leverages the work already done but ensures consistency with existing literature, enhancing the comparative value of the research.
In qualitative studies like interviews, reliability and validity take on a nuanced dimension as the data is subjective. Here, reliability might mean consistency in interview questions, while validity could involve the interview’s ability to capture true personal experiences related to health.
Practical Considerations in Instrument Selection
When selecting instruments for health research, validity and reliability are paramount, however, researchers also must weigh practical considerations (Creswell and Creswell 2017). Cost of an instrument is a major factor, especially in large-scale studies or those with limited funding. The instrument should be readily accessible to the target population and sample. For example, online surveys might not be suitable for populations with limited internet access or elderly who do not have necessary technology competencies. Instruments should be user-friendly for both participants and researchers. Complicated tools may lead to lower response rates or inaccurate data. The length of time needed to administer the instrument should be manageable for both participants and researchers. The individuals administering the instrument may require training to ensure consistency and accuracy in data collection. For electronic instruments, researchers need to consider software compatibility, data security, and technical support.
Additionally, there are considerations for specific populations and settings. Instruments should be culturally appropriate and sensitive to the norms and values of the population being studied. Tools must be available in the languages spoken by the participants to ensure comprehension and accurate responses. The instrument should be suitable for the environment in which the research is conducted, whether it’s a clinical setting, a community center, or a participant’s home.
Overview of ABCD Instrumentation
The Adolescent Brain Cognitive Development (ABCD) Study employs a wide array of instruments to collect comprehensive data from its participants, spanning both imaging and non-imaging domains. Students should take time to explore these instruments and data types in the ABCD wiki and ABCD data dictionary explorer. The ABCD Data Wiki provides detailed information on the specific instruments used in the study, including the administration procedures, scoring methods, and data collection protocols.
Imaging Instruments:
The ABCD Study utilizes advanced neuroimaging techniques to investigate brain structure and function, including:
- Structural MRI: Used to measure brain volume, cortical thickness, and other structural features of the brain.
- Functional MRI (fMRI): Assesses brain activity by detecting changes in blood flow, used during both resting state and task-based conditions.
- Diffusion MRI: Provides insights into the microstructural organization of white matter tracts in the brain.
Imaging protocols are standardized across all ABCD study sites to ensure consistency and reliability of the data.
Non-Imaging Instruments:
The non-imaging domain of the ABCD Study encompasses a broad range of assessments, including but not limited to:
ABCD General:
Including demographics information on participant age, race, ethnicity, family structure, and family history. Also encompassing latent factors related to economic, social, and physiological well-being; youth perceived social support; and a latent factor for perinatal health.
Culture & Environment:
Including assessments of family and neighborhood environments, such as family patterns and conditions, neighborhood safety, social and/or cultural conflict, and neighborhood qualities. Information on school environments, characteristics, and peer groups is also collected, along with assessments of peer relationships, family conflict, and exposure to stressors.
Gender Identity and Sexual Health:
Including questions regarding participants’ gender identity and expression, as well as assessments of sexual behaviors, attitudes, and knowledge.
Genetics:
Including genetic data, with the ABCD Study providing genome-wide single nucleotide polymorphism (SNP) genotype data obtained from DNA samples provided by the participants. These instruments allow for genome-wide association studies (GWAS) and explorations of associations between specific genetic variants and various behavioral and cognitive outcomes.
Linked External Data:
Including linkage to academic records for information on school performance and educational outcomes, as well as linkage to external datasets on the social and environmental contexts of participants’ zip codes.
Mental Health:
Including assessments of psychopathology, such as depressive symptoms, anxiety, and other psychiatric conditions. Questions regarding experiences of trauma and stress are also part of this domain.
Neurocognition:
Including tests designed to evaluate various cognitive functions, such as memory, attention, executive function, and language skills. Instruments include the NIH Toolbox Cognitive Battery, which provides a comprehensive assessment of cognitive abilities.
Novel Technologies:
Including assessments of screen time, data from smartphones, and data from Fitbits to assess physical activity.
Physical Health:
Including anthropometrics (height, weight, and body composition), blood analysis, and nutritional, sleep, and exercise assessments.
Substance Use:
Including questionnaires about the use of alcohol, tobacco, and other drugs, and assessments of beliefs and attitudes toward substance use.
Examples of Instrumentation Sections of Published Studies with ABCD
Finally, we will consider three ABCD publications and the instrumentation section of each.
Example 1:
Wu, Feifei, et al. “Stimulant medications in children with ADHD normalize the structure of brain regions associated with attention and reward.” Neuropsychopharmacology (2024): 1-11.
Research question and hypothesis: The researchers (Wu, Feifei, et al. 2024) assessed the impact of stimulant medications on brain structures after improvement of attention-deficit/hyperactivity disorder (ADHD) symptoms by investigating the differences in psychometric measures and brain morphometry among youth with ADHD and no medication, children with low ADHD symptoms and received stimulant medication) and typically developing controls in ABCD. They hypothesized that stimulant medication treatment of ADHD would be associated with “improvement of structural brain abnormalities in regions implicated in saliency detection (i.e., ACC and INS) and reward processing (i.e., NAc).”
Instrumentation: The author’s instrumentation section is located under the sections “Structural MRI acquisition” and “Clinical measures, medications, and demographics.” In the former, the investigators describe ABCD brain imaging protocols and the specific data that the researchers used for the study. This includes the type of MRI scans, and ABCD processing of the data and quality control measures taken. These are the imaging instruments used to take measurements for the study’s dependent variables – brain structure.
Quoted at length:
Structural MRI acquisition
Children underwent 3T MRI (including Siemens, General Electric, or Phillips scanner) to obtain high-resolution T1-weighted structural MRI images (1 mm isotropic voxels) [39]. All structural MRI data were processed by the ABCD Study team using FreeSurfer version 7.1.1 to perform skull-stripping, white matter segmentation, initial mesh creation, correction of topological defects, and nonlinear registration to a spherical surface-based atlas [40]. MRI quality control was manually checked by trained MRI analysts from the ABCD Study team (0 = excluded, 1 = included). Morphometric measures (cortical thickness, area, volume, subcortical volume, and total intracranial volume-ICV) were included in the current analysis. Cortical regions-of interest (ROIs) were those in the Desikan-Killiany atlas [41] and subcortical ROIs were those of the atlas-based segmentation [40, 41] (Wu, Feifei, et al. 2024).
In “Clinical measures, medications, and demographics”, the author’s outline the instruments used to measure on their independent and control variables. These included:
- Kiddie Schedule for Affective Disorders and Schizophrenia (K-SADS): This instrument was used to assess symptoms of ADHD in participants. The K-SADS is a semi-structured interview that is widely used in clinical and epidemiological studies of psychiatric disorders in children and adolescents.
- Medication Inventory: Information on the names and dosages of all medications taken by the child was extracted from a parent-reported inventory. This included both stimulant medications (e.g., methylphenidate, amphetamine) and non-stimulant medications (e.g., atomoxetine, clonidine) for ADHD.
- Child Behavior Checklist (CBCL): This instrument was employed to assess psychiatric symptoms in children. The CBCL is a widely used questionnaire that records behavioral problems and competencies of children as reported by their caregivers. It includes syndrome scales related to various psychiatric problems and provides T-scores for clinical and functioning scales.
- Brief Problem Monitor – Teacher (BPM-T): This instrument was used to examine psychometric symptoms by investigating differences in psychometric measures among the study groups. The BPM-T includes 18 items distributed across three subscales: attention/hyperactivity problems, externalizing problems, and internalizing problems.
- Demographic Questionnaire: Information on children’s age, sex, race/ethnicity, and socioeconomic factors such as the caregiver’s highest educational level and family income was collected to control for these variables in the analysis.
Example 2:
Assari, Shervin, et al. “Behavioral and psychosocial correlates of hope among youth.” Journal of Medicine, Surgery, and Public Health 2 (2024): 100088.
Research questions: The study aimed to explore the psychosocial and behavioral correlates of hope in 9–10-year-olds transitioning into adolescence (Assari, Najand et al. 2024). Specifically, it investigates how hope correlates with future substance use and how various factors such as age, gender, socioeconomic status, stress, behavioral problems, impulsivity, sensation seeking, cognitive function, blood pressure, and body mass index are associated with hope.
Instrumentation: The author’s instrumentation section is in 2.3 Study Variables. The main variable of interest, “hope,” provides an excellent case of operationalizing a complex concept. Here the authors describe their operationalization of hope:
2.3.1. Hope
Using the kiddie schedule for affective disorders and schizophrenia (KSADS) [36], we used parental report regarding present hopelessness at baseline. This variable was coded as a dichotomous variable 1 for hope and 0 for lack of hope (hopelessness in the present). KSADS is commonly used as a structured interview for diagnosis of psychiatric disorders based on elements such as hopelessness and many other signs and symptoms [37].
The author’s instrument for hope is the Kiddie Schedule for Affective Disorders and Schizophrenia (K-SADS), which is a semi-structured diagnostic interview designed to assess current and past episodes of psychopathology in children and adolescents according to the Diagnostic and Statistical Manual of Mental Disorders (DSM) criteria. The K-SADS is used to diagnose affective disorders (such as depression and bipolar disorder), anxiety disorders, psychotic disorders, and other psychiatric conditions in children and adolescents. It also assesses the severity of symptoms and their impact on functioning. It is one of the most widely used diagnostic tools in child and adolescent psychiatry research and clinical practice. As noted by the study author’s citations, the K-SADS has demonstrated good reliability and validity in diagnosing psychiatric disorders in children and adolescents (citations 36 ad 37 in the study).
The authors imply that they used a summary score method to count responses from the parents of youth participants about the youth participant’s attitudes and behaviors associated with hope and hopelessness. Presumably, based on the summary scores, the authors then determined a threshold number to divide the youth into two groups – one for hope and the other for lack of hope.
The rest of Section 2.3 details instruments used to assess correlates of hope and lack of hope – including instruments measuring marijuana and tobacco use, family income, stressful life events and financial difficulties, behavioral problems, impulsivity, sensation seeking, cognitive function, parental education, neighborhood income, family conflict, blood pressure, body mass index, grade point average, prosocial behaviors, and puberty.
Summary
In this chapter, we gained an intuition for instrumentation in health research, it’s distinction from operationalization and measurement, and an overview of various types of instruments used in health studies. We also scratched the surface on the challenges of operationalizing complex constructs and highlighted the importance of reliability and validity in instrumentation. By carefully selecting and utilizing appropriate instruments, researchers can generate robust data that contribute to advancing knowledge in the field of health studies. The next chapter on research procedures identifies the steps of carrying out the data collection, which includes the use of research instruments.