
6 Chapter 6: Sampling
Learning Objectives
- Understand the purpose of sampling in health research and the importance of minimizing bias and ensuring representativeness in research samples.
- Articulate common sampling methods, including random and non-random techniques, and their impact on study quality and generalizability.
- Explore the principles of determining sample size in clinical trials and observational studies, with a focus on statistical power and practical constraints.
- Gain insights into sample size determination in qualitative studies, emphasizing the concept of saturation.
Key Terms
- Sampling: The process of selecting a subset of individuals from a larger population to participate in a study.
- Representativeness: The extent to which a sample accurately reflects the characteristics of the population.
- Bias: Systematic errors in the sampling process that can lead to inaccurate or misleading conclusions.
- Probability Sampling Methods: Techniques such as simple random sampling, stratified random sampling, and cluster sampling, where each member of the population has a known chance of being selected.
- Non-Probability Sampling Methods: Techniques such as convenience sampling, purposive sampling, and snowball sampling, where not every member of the population has a known or equal chance of being selected.
- Statistical Power: The probability of detecting a given effect size with a given sample size.
- Saturation: In qualitative research, the point at which no new information or themes are emerging from the data.
Introduction to Sampling
In health research, a research population encompasses all individuals of interest in a study, while a sample is a subset of this population, selected for actual data collection. The process of selecting a sample, known as sampling, is crucial for making inferences about the larger population based on the data collected from the sample.
Sampling is all about quality over quantity. Quality in sampling primarily refers to representativeness and minimized bias. A representative sample accurately reflects the characteristics of the population, enabling generalizable conclusions. Minimizing bias ensures that the sample selection process does not systematically favor certain outcomes over others, or any other form of deviation (error) from population characteristics.
In determining quantity in a sample, statistical power is a key consideration. It refers to the probability of correctly detecting a true effect in the study. A study with adequate statistical power can reliably distinguish between real effects and random variations, reducing the risk of both false positives and false negatives. Effective sampling strategies, along with careful consideration of statistical power, are essential for conducting rigorous and meaningful health research.
Defining the Research Population & Sample
Remember that the study sample is a subset of the research population that is selected for actual data collection. Researchers therefore need a defined inclusion and exclusion criteria for building a sample.
Developing Inclusion/Exclusion Criteria
Defining inclusion and exclusion criteria is the process of setting specific standards for who is included in a sample and who is not. These criteria ensure that the sample is relevant to the research questions and objectives and that the integrity of the study is maintained (Fink 2003, Keung, McElroy et al. 2020).
- Experimental Designs: In experimental studies, such as clinical trials, inclusion criteria might specify characteristics that participants must have to be eligible for the study, such as a specific medical condition or age range. Exclusion criteria, on the other hand, might rule out potential participants who have certain conditions or characteristics that could interfere with the study results. For example, a clinical trial for a new diabetes medication might include patients with type 2 diabetes aged 18-65 and exclude those with other serious medical conditions.
- Observational Designs: In observational studies, inclusion criteria may be based on demographic characteristics, exposure to certain conditions, or the availability of data. For instance, an observational study on the impact of air pollution on asthma might include residents of urban areas with high pollution levels and exclude individuals with pre-existing lung conditions unrelated to asthma.
Developing inclusion and exclusion criteria brings many risks of bias in the sample, which means some form of error (deviation) from the true population and misrepresentation of the research population. Therefore, sampling methods must be carefully designed to minimize this bias. Random sampling is the most effective strategy, and there are techniques for non-random sampling as well.
Random Sampling Methods
Random sampling methods are key to ensuring that the sample is representative of the population, thereby enabling generalizability of a study’s findings. Chapter 4 on study design discussed the role of randomization, particularly in randomized clinical trials (RCTs), in controlling confounding factors, which are variables that influence the relationship between independent and dependent variables but are unaccounted for in the study design. By ensuring that each member of the population has an equal chance of being selected into treatments, random sampling reduces the likelihood that the sample will be biased by confounding factors. This is particularly important in health research, where confounding factors such as age, gender, socioeconomic status, and health behaviors can significantly influence study outcomes. By minimizing bias, random sampling helps researchers to draw more accurate and generalizable conclusions about the relationship between variables, and thereby test hypotheses.
There are several types of random sampling methods, each with its advantages and disadvantages.
- Simple Random Sampling: Every member of the population has an equal chance of being selected. This method is straightforward and ensures unbiased representation. However, it may not always be practical for large populations. For example, in a study investigating the prevalence of hypertension in a small town, researchers might use a random number generator to select participants from a list of town residents, ensuring that each person has an equal chance of being included in the sample.
- Stratified Random Sampling: The population is divided into strata (subgroups) based on certain characteristics, and a random sample is taken from each subgroup. This method ensures representation of key subgroups but requires prior knowledge of the population structure. Researchers often leverage stratified random sampling when they might reasonably expect the measurement of interest to vary between the different subgroups, and they want to ensure representation from all the subgroups. For example, in a study of stroke outcomes, we may stratify the population by sex, to ensure equal representation of men and women. The study sample is then obtained by taking equal sample sizes from each stratum.
- Cluster Sampling: The population is divided into clusters (usually based on geography), and a random sample of clusters is selected. Then, all individuals within the chosen clusters are included in the sample. This method is cost-effective for large, dispersed populations but can introduce cluster-level bias. An example of cluster sampling might be a study examining the prevalence of diabetes in a rural area. Researchers could divide the area into clusters based on villages and randomly select a few villages to be included in the study. All residents of the selected villages would then be included in the sample.
Even with a simple random sample, representation of the entire population is not guaranteed. High non-response rates in surveys can indicate sample bias. For instance, if a survey’s questions presume English fluency, a significant non-response from a population mainly comprising non-English speakers is expected. Such bias from non-response can distort results, and drawing conclusions from a sample that does not represent the population can lead to inaccurate inferences about the population.
Non-Random Sampling Methods
Non-probability sampling methods are used when it is not feasible or practical to use random sampling (Saldana 2011). In these methods, not every member of the population has an equal chance of being selected, which can introduce bias. However, non-probability sampling can be useful in exploratory research, qualitative studies, or when a specific subset of the population is of interest, and in certain cases may not be readily available for participation. Below are some common non-probability sampling methods:
- Convenience Sampling: Participants are selected based on their availability and willingness to take part in the study. This method is quick and easy but may not be representative of the larger population. For example, a researcher studying stress levels might survey students in a university library during exam week, as they are readily available, but this sample might not represent all university students.
- Purposive Sampling: Participants are selected based on specific characteristics or criteria relevant to the research question. This method is used when researchers want to study a particular subgroup within the population. For example, in a study investigating the experiences of cancer survivors, researchers might purposively select individuals who have completed cancer treatment within the last year.
- Snowball Sampling: This method is used when the population is hard to reach or identify. Existing study participants refer other potential participants from their network. While this can help access a specific population, that in many cases may be difficulty to identify, it may lead to a biased sample. For example, in a study on intravenous drug use, researchers might ask participants to refer other individuals also use drugs intravenously.
Each of these non-probability sampling methods has its advantages and disadvantages. Convenience sampling is quick and easy but may not be representative. Purposive sampling allows for focused study of a specific subgroup but may not generalize to the larger population. Snowball sampling can access hard-to-reach populations but may introduce bias through the referral process.
Determining Sample Size in Clinical Trials
How many research participants does a clinical trial need? Determining the appropriate sample size in clinical trials is a critical aspect of study design that is influenced by both scientific and practical considerations. The sample size impacts the ability of the clinical trial to detect meaningful effects, as well as its feasibility and ethical implications.
Economic and Ethical Considerations in Determining Sample Size
From an economic perspective, larger sample sizes increase the cost and complexity of a trial. It is important to balance the need for a sufficient sample size with the financial resources available. Ethically, researchers must ensure that the sample size is neither too small nor too large. A sample size that is too small may fail to detect important effects, potentially wasting resources and exposing participants to unnecessary risks without the benefit of meaningful results. Conversely, a sample size that is too large may expose more participants than necessary to experimental treatments or procedures.
Introduction to Statistical Power and Effect Sizes
As researchers must avoid a sample size that is too small or too big, they need to balance various considerations. Typically, the guiding question is, “Will a statistical test (e.g., hypothesis test) reveal a difference between the treatment and control groups?” (Lipsey 1990). That group difference is referred to as effect size. Effect sizes are the measured differences in outcomes between groups and/or the strength of relationships between variables (Bruce, Bruce et al. 2020).
The specific measure of effect size is determined by the specific type of statistical test, which is determined by the research question or hypothesis (discussed further in Chapter 9). Relevant literature will guide a researcher’s matching of research question and statistical test. In many instances in health research, effect sizes are measured in terms in terms of an outcome variable (dependent variable). For example, in a clinical trial testing a new drug, the effect size might be measured as the difference in the mean outcome (such as blood pressure reduction) between the treatment group and the control group. This would provide a standardized measure of the drug’s effectiveness. Other examples include the risk ratio or odds ratio in epidemiological studies, which measure the strength of the association between an exposure and a health outcome.
Statistical power is the probability of detecting a specified effect size with specified sample characteristics (size and variability). For example, in a vaccine trial, we might hypothetically say that the probability of distinguishing between a vaccine that reduces infection rates by 60% and one that reduces them by 30% with a sample size of 500 participants is 0.80. The effect size here is a difference of 30% in infection reduction rates. And “detecting” means that a hypothesis test will reject the null hypothesis of “no difference” and conclude there is a real effect. The experiment with 500 participants, with an effect size of 30% reduction, has (hypothetical) power of 0.80, or 80%.
Calculating Sample Size
To determine statistical power or sample size, researchers need three of the four datapoints below. That is, if you know three, then the fourth can be calculated.
- Effect Size: The effect size represents differences between groups and/or the strength of the relationship between variables, in other words, “How much of a change in the treatment group justifies the clinical use of the treatment?” (Lipsey 1990) Researchers typically determine minimum effect size from the literature and previously reported effect sizes of similar tests. The research hypothesis often also specifies this effect size, which is also typically based in the literature. Larger effect sizes can be detected with smaller sample sizes, and small effect sizes are typically detected with large samples.
- Significance Level (α): Also known as the p-value, the significance level (α) determines the probability that effect sizes occurred by chance (given the sampling methods). Specifically, if we assumed the null hypothesis (no effect), and we developed a random model that assumes the null hypothesis, the p-value is the probability of obtaining results as unusual or extreme as the observed results (Bruce, Bruce et al. 2020). Researchers set a threshold (commonly α = 0.05) for rejecting the null hypothesis. Smaller α values (more stringent) typically require larger sample sizes.
- Statistical Power: Statistical power is the probability of correctly detecting a true effect. Researchers aim for high power (typically ≥ 80%) to minimize false negatives (Serdar, Cihan et al. 2021). This means that if the test were conducted 100 times, 80 out of the 100 statistical tests will detect the effect size. Larger sample sizes increase statistical power.
- Variability (Standard Deviation): Standard deviation refers to the amount of variation or dispersion in a given dataset. Greater variability within the population requires larger samples. Researchers estimate the standard deviation based on pilot data or prior studies.
Researchers use these parameters to determine the minimum number of participants needed to detect a meaningful difference between groups. Calculation software and statistical formulas are often used to facilitate this process. Here is an example of a sample size calculation tool.
Example
As a hypothetical example, imagine a clinical trial investigating a new drug for lowering blood pressure, researchers might determine from previous studies that a reduction of 5 mmHg in systolic blood pressure is the minimum clinically important difference. If the standard deviation of blood pressure measurements in the target population is 10 mmHg, and the researchers aim for 80% power with a significance level of 0.05, they can use a sample size calculator to find that approximately 128 participants are needed in each group (treatment and control) to detect this effect size.
In summary, determining the sample size in clinical trials is a multifaceted process that involves balancing statistical requirements with practical limitations. A well-calculated sample size ensures that the trial can achieve its objectives while being economically feasible and ethically responsible.
Determining Sample Size in Observational Studies
Unlike randomized controlled trials, in observational research designs (including epidemiology), sample sizes are often determined by balancing considerations across study design factors, statistical objectives, and practical constraints (Elashoff and Lemeshow 2005).
Study Design Factors
Observational studies primarily focus on understanding associations between exposures and outcomes, with sample size varying based on research questions. As observational studies are more exploratory rather than confirmatory (Chapter 2), this means that sample size determination is less rigidly tied to statistical power calculations. Additionally, a key distinction between observational studies and RCTs is the lack of randomization. Participants in observational studies “self-select” into exposure groups, which can introduce bias and confounding factors. Researchers need to account for potential biases and ensure that the sample is representative of the population of interest.
For example, in an observational study investigating the association between air pollution and asthma incidence, researchers may choose to focus on urban areas with varying levels of pollution. The exposure of interest is air pollution, and the outcome is the incidence of asthma. The sample size would depend on the expected prevalence of asthma and the degree of variability in pollution levels across different urban areas.
Statistical Objectives
In conjunction with study design features, researchers typically make sample size determinations based on the statistical objectives of the study. These may include:
- Effect Size: Previously defined, in observational studies, researchers often refer to the literature to determine the minimum effect size that is meaningful or clinically significant.
- Significance Level (α): The significance level represents the probability of rejecting the null hypothesis when it is true. A common threshold is α = 0.05. Lower α values increase the likelihood of detecting true effects but require larger sample sizes. It is important to differentiate between statistical significance and practical significance. Statistical significance indicates that an observed effect is unlikely due to chance, while practical significance assesses whether the effect is large enough to be meaningful in a clinical setting or real-world context. For example, in an epidemiological study exploring the link between smoking and lung cancer, researchers may set a significance level of α = 0.01 to reduce the chance of a false positive, given the public health implications of the findings.
- Statistical Power: Statistical power is the probability of correctly identifying a true effect. Increasing the sample size strengthens the statistical power, reducing the risk of false negatives. However, studies with large sample sizes and strong statistical power can detect statistically significant effect sizes that may or may not be clinically meaningful, as mentioned above. For example, in a study assessing the impact of exercise on mental health outcomes, researchers aim for 90% power to ensure a high probability of detecting a true effect of exercise on reducing symptoms of depression.
- Outcome Variability: The variability in the outcome measure affects the required sample size. Greater variability necessitates larger samples to achieve precise estimates of the effect size. Additionally, a sufficiently large sample size is crucial for obtaining narrow confidence intervals, which provide more precise estimates of the population parameters. For example, in a study investigating the effects of a new educational intervention on student behavior, the variability in behaviors among students may require a larger sample size to accurately estimate the intervention’s effect.
In the context of observational epidemiology, the emphasis is on observing relationships between exposures and outcomes rather than evaluating treatment effects. This requires a sample size that provides sufficient power to identify meaningful associations.
Practical Constraints
Observational studies will also face practical constraints in sample size and quality, such as feasibility. While clinical trials are often expensive and resource-intensive, observational studies may use existing data, which can be more cost-effective. In observational epidemiology, the sample size may be influenced by the availability of existing data. Using existing data can be cost-effective and efficient, but researchers must ensure that the data are sufficient and appropriate for addressing the research questions. The availability of large datasets, such as electronic health records or national survey data, can enable researchers to conduct studies with larger sample sizes without incurring additional costs. However, the sample size in these studies is still influenced by data availability and the resources required to collect and analyze the data. For example, in an observational study using electronic health records to examine the prevalence of a rare disease, the sample size may be limited by the availability of relevant data in the existing records. In cases of producing new data, the feasibility of conducting the study, including the availability of resources, can significantly impact the sample size. Researchers must balance scientific rigor with practical constraints such as cost, time, and available participants.
Determining Sample Size in Qualitative Studies
Unlike quantitative research, where sample size is often determined based on statistical power calculations, sample size in qualitative studies is guided by different principles. The goal of qualitative research is to gain a deep understanding of a phenomenon, experience, or culture, which requires a different approach to sample size determination (Saldana 2011).
The Concept of Saturation in Qualitative Research
Saturation is a key concept in determining sample size in qualitative research, particularly in interviews. It refers to the point at which no new information or themes are emerging from the data, indicating that the sample size is sufficient to capture the depth and complexity of the phenomenon under study. Saturation is reached when additional data collection does not lead to new insights or understanding, and it signals that the study has achieved an adequate depth of understanding. In research proposals, researchers may guess a sample size based on sample sizes from previous comparable studies.
Sample Size Factors in Qualitative Studies
There are no fixed rules for determining sample size in qualitative research, but several guidelines can help researchers make informed decisions:
- Purpose of the Study: The research objectives and the complexity of the phenomenon being studied influence the sample size. Studies aiming to explore a broad or complex issue may require a larger sample to achieve saturation.
- Sampling Strategy: The choice of sampling strategy, such as purposive sampling or snowball sampling, impacts the sample size. Researchers should select participants who can provide rich and relevant information about the research topic and/or can introduce new research participants.
- Quality of Data: The richness and depth of the data collected from each participant are more important than the number of participants. A smaller sample of detailed and meaningful data can be more valuable than a larger sample of superficial data.
- Resource Constraints: Practical considerations, such as time, budget, and access to participants, also influence sample size decisions. Researchers must balance the need for depth with the resources available.
Example
In a qualitative study exploring patients’ experiences with a new telemedicine service, the researcher might begin with a small sample of patients who have used the service. Through in-depth interviews, the researcher seeks to understand their experiences and perceptions. As more interviews are conducted, the researcher pays attention to whether new themes are emerging. Once the interviews no longer yield new insights, and the themes are well-developed and understood, saturation is reached, and the sample size is deemed sufficient.
Participant Recruitment Strategy
After determining sampling methods and size, researchers must develop a participant recruitment strategy. This strategy encompasses identifying the target population, choosing the right channels for recruitment, and addressing potential challenges that may arise during the recruitment process. Below are details and examples to guide the creation of this section.
- Recruitment Channels: After identifying the target population in the sampling methods, researchers must develop recruitment channels that are most likely to reach the target population effectively. These can include medical clinics for health-related studies, social media platforms, community centers, and educational institutions. For example, recruiting participants for a study on childhood vaccination effectiveness might involve partnering with pediatric clinics and schools.
- Incentives and Motivations: Researchers must consider what incentives or motivations might encourage participation. This could range from financial compensation to the opportunity to contribute to scientific knowledge. In a study on exercise habits, participants might be motivated by receiving a summary of their physical activity levels and personalized health advice.
- Addressing Challenges: Researchers need to anticipate and plan for potential recruitment challenges. High non-response rates can indicate barriers to participation such as language differences, privacy concerns, or lack of interest. Strategies to overcome these barriers might include providing information in multiple languages, ensuring confidentiality, and clearly communicating the study’s benefits.
Incorporating these elements into the participant recruitment strategy section will provide a comprehensive overview of how to attract and enroll participants effectively, ensuring that the study sample is representative and supportive of the research objectives.
The ABCD Sample
The specific details of ABCD sampling methods and participant recruitment are detailed in:
Garavan, H., Bartsch, H., Conway, K., Decastro, A., Goldstein, R.Z., Heeringa, S., Jernigan, T., Potter, A., Thompson, W. and Zahs, D., 2018. Recruiting the ABCD sample: Design considerations and procedures. Developmental cognitive neuroscience, 32, pp.16-22.
However, some main features are reproduced here for the sake of convenience and example of concepts in the chapter. The ABCD Study is an ongoing prospective cohort study that tracks a group of American children born from 2006 to 2008. Initially, 11,880 children aged 9-10 years (along with their parents/guardians) were enrolled from 21 active sites out of an original 22. They are to be monitored for a decade or more. The recruitment phase targeted children from specific geographic areas surrounding each site, occurring from September 2016 to October 2018.
Sampling Methods Used in ABCD
The ABCD study primarily employs a multi-stage probability sampling method for recruitment. The process begins with a nationally distributed set of 21 primary study sites, followed by a probability sampling of schools within the defined catchment areas for each site. The study aims to recruit a baseline cohort of 9 and 10-year-old children by sampling schools and consenting students and their parents. This approach helps to represent the US population’s demographic variability and is designed to minimize sampling biases. In four specific “twin-hub” sites, twins were identified and recruited using birth registries (discussed in Chapter Four).
Participant Recruitment Strategies in ABCD
ABCD uses school-based recruitment, which includes both public (including charter schools) and private schools, as the primary method to contact and recruit eligible children and their parents. A smaller portion of participants joined through community outreach and recommendations from others. The strategy includes classroom presentations, PTA meetings, and parent nights to foster a collaborative attitude between researchers, schools, and local communities. The recruitment is designed to be comprehensive and inclusive, reaching a wide demographic by leveraging the school systems where the children are enrolled.
ABCD Sample Inclusion/Exclusion Criteria
The study specifically targets single births and twins aged 9 and 10 years at baseline, with detailed demographics including gender, race and ethnicity, socioeconomic status, and urbanicity. The inclusion criteria aim to reflect the national population’s sociodemographic diversity accurately. There is a concerted effort to ensure a balanced representation, including slight oversampling of certain demographics based on specific research objectives. The criteria for joining the study varied by site but generally included being within the specified age range and the ability to give informed consent (parents) and assent (children) (Garavan, et al. 2018; Dick, Lopez et al. 2021). Exclusions were few, mainly involving children who were not proficient in English, had severe sensory, intellectual, medical, or neurological conditions that could affect the reliability of the data or their compliance with the study protocol, and those with contraindications for MRI scans (Garavan, et al. 2018; Dick, Lopez et al. 2021). Parents had to be proficient in English or Spanish.
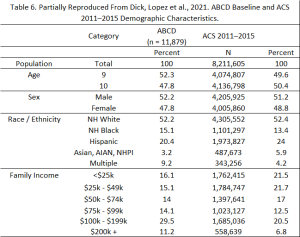
Demographic Information of the ABCD Sample
The demographic targets for the ABCD baseline cohort are derived from the American Community Survey (ACS) and school enrollment data, ensuring that the sample mirrors national sociodemographic proportions closely. Baseline demographic data for the ABCD sample (from NDA Release 2.0.1) are outlined in Table 6 (partially reproduced from Dick, Lopez et al. 2021), alongside a comparison to statistics from the American Community Survey. The ACS is a comprehensive annual survey of US households by the US Bureau of Census, serving as a reference for certain demographic and socioeconomic traits of US children aged 9-10 years. The 2011-2015 ACS Public Use Microsample (PUMS) file includes data from over 800,000 US households, with 376,370 individual records for children aged 9-10 and their families.
The sampling design incorporates adjustments for any deviations from these targets during recruitment to maintain the cohort’s representativeness. This includes considerations for gender, race and ethnicity, socioeconomic status, and urbanicity to ensure a diverse and representative sample. The unweighted distributions of the ABCD baseline sample, with some slight variations, closely align with the national estimates based on the ACS for demographic characteristics such as age, sex, and household size (Dick, Lopez et al. 2021). This close alignment can be largely attributed to three factors: 1) the diverse demographics across the ABCD study sites; 2) the use of stratification by race/ethnicity in the probability sampling of schools within each site; and 3) the implementation of demographic controls in the recruitment process by the site teams (Garavan, et al. 2018; Dick, Lopez et al. 2021). Similarly, the unweighted percentages of ABCD children in the most common race/ethnicity categories closely resemble the ACS estimates for US children aged 9 and 10.
Examples of Sampling Methods in Published ABCD Research
Finally, let’s consider some published research with the ABCD study and different approaches to sampling.
Example 1:
Paulich, K.N., Ross, J.M., Lessem, J.M. and Hewitt, J.K., 2021. Screen time and early adolescent mental health, academic, and social outcomes in 9-and 10-year old children: Utilizing the Adolescent Brain Cognitive Development℠(ABCD) Study. PloS one, 16(9), p.e0256591.
Research question: The implied research question was, does depression play a mediating role in the association between screen time and binge-eating disorders? (Paulich, Ross et al. 2021)
Sampling: The provide a clear overview of their inclusion and exclusion criteria in the Participants section of the study, quoted at length here:
2.1|Participants
The ABCD study, established in 2016–2018, is an ongoing longitudinal, epidemiological study of brain development and child health in the U.S. 11,875 children (aged 9–10 years) were recruited from21 recruitment sites. Details about the ABCD Study participants, recruitment, protocol, and measures are reported elsewhere (Barch et al.,2018). The current study utilized data from baseline to year 2 of the ABCD study. We excluded those with missing data for screen time or covariates at baseline (n=1262), depression symptoms at baseline and year 1 (n=534), and BED diagnosis at year 2 (n=614) (see Table A1 for a comparison of characteristics of included and excluded participants), with 9465 participants remaining for the current analyses.
In short, the exclusion criteria were missing data for the variables of interest.
Example 2:
Raney, J.H., Weinstein, S., Ganson, K.T., Testa, A., Jackson, D.B., Pantell, M., Glidden, D.V., Brindis, C.D. and Nagata, J.M., 2024. Mental Well-Being Among Adversity-Exposed Adolescents During the COVID-19 Pandemic. JAMA Network Open, 7(3), pp.e242076-e242076.
Research question: As stated by the authors, “What factors were associated with higher adolescent well-being and lower stress during the COVID-19 pandemic, particularly among adolescents who had adverse childhood experiences (ACEs)?” (Raney, Weinstein et al. 2024)
Sampling: The authors reference the ABCD sample and sample recruitment, then describe their inclusion/exclusion criteria for the study, which is simply based on data availability for participants. The most relevant section is under Methods:
“This study uses adolescent responses to the March 2021 COVID Rapid Response Research Survey 6 (the final COVID survey), when there was the greatest heterogeneity of in-person vs virtual schooling in our cohort (46% reported online schooling only). Adolescents who did not participate in either the PA or PS questionnaires for the COVID RRR Survey 6 were excluded (7447 adolescents).”
Under Results and Table 1 the authors describe the demographic characteristics of the sample that they used:
“The analytic sample of 4515 adolescents (mean [SD] age, 13.3 [0.88] years; 51% [95% CI, 50%-53%] female) was racially and ethnically diverse (American Indian/Alaska Native, 2% [95% CI, 2%-3%]; Asian, 8% [95% CI, 7%-9%]; Black, 11% [95% CI, 10%-12%]; Latino or Hispanic, 17% [95% CI, 15%-18%]; White, 61% [95% CI, 60%-63%]; other, 1% [95% CI, 0%-2%]).”
Summary
In this chapter, we explored the critical role of sampling in health research, emphasizing the importance of representativeness and minimized bias. We discussed various sampling methods, including random and non-random techniques, and their implications for study quality and generalizability. We also gained insight into the determination of sample size in clinical trials and observational studies, highlighting the balance between statistical power and practical constraints. The chapter concluded with a focus on qualitative studies and the unique approach to sample size determination based on saturation. The ABCD Study and its twin subsample were presented as examples to illustrate the application of these concepts in a large-scale research project.