
Introduction
Introduction to Data Science & Addiction Research Methods
Biomedical research increasingly uses longitudinal datasets that follow participants over time and combine information from surveys, behavioral tasks, health measures, biospecimens, genetic data, environmental context, and neuroimaging. Bringing these sources together allows researchers to examine questions that a single survey, clinic, or laboratory could not answer alone, including how social environments, development, biology, family experiences, and policy conditions relate to health and substance use over time.
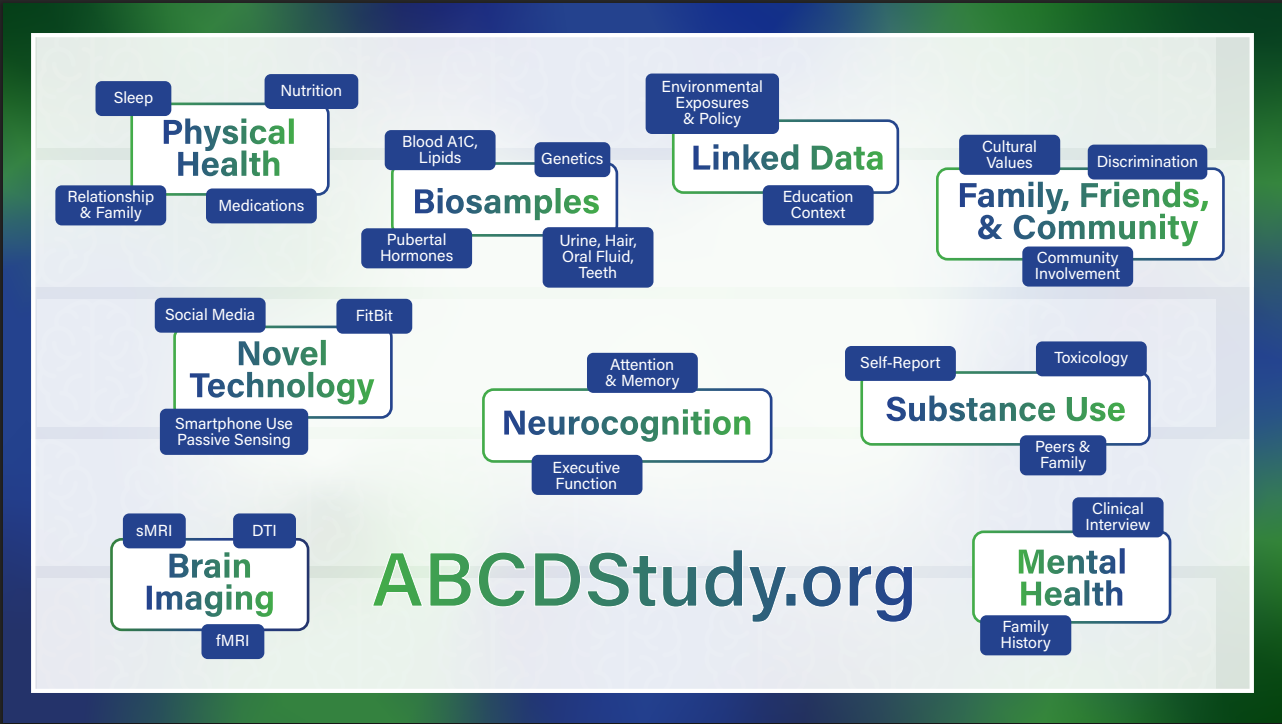
Throughout this textbook, the Adolescent Brain Cognitive Development (ABCD) Study serves as a central example. ABCD is a large, multisite study of young people that collects information across many connected areas of development, behavior, health, and environment. Figure 0.1 provides a high-level orientation to those data domains.
Data do not simply appear in a file ready for analysis. Each value reflects decisions about study design, recruitment, consent, measurement, collection procedures, quality control, documentation, storage, access, and reuse. A survey response, laboratory result, genetic variant, or brain-imaging measure therefore has both a scientific meaning and a history.
Figure 0.2 introduces the framework used throughout this course. Data infrastructure includes the people, equipment, settings, procedures, and materials that make research data possible. Data architecture includes the digital structures through which data are organized and analyzed, such as DataFrames, identifiers, linked datasets, longitudinal records, metadata, network data, and genomic variants. Ethics, governance, and regulation connect these domains by shaping what may be collected, how sensitive information is protected, and who may access or reuse it.
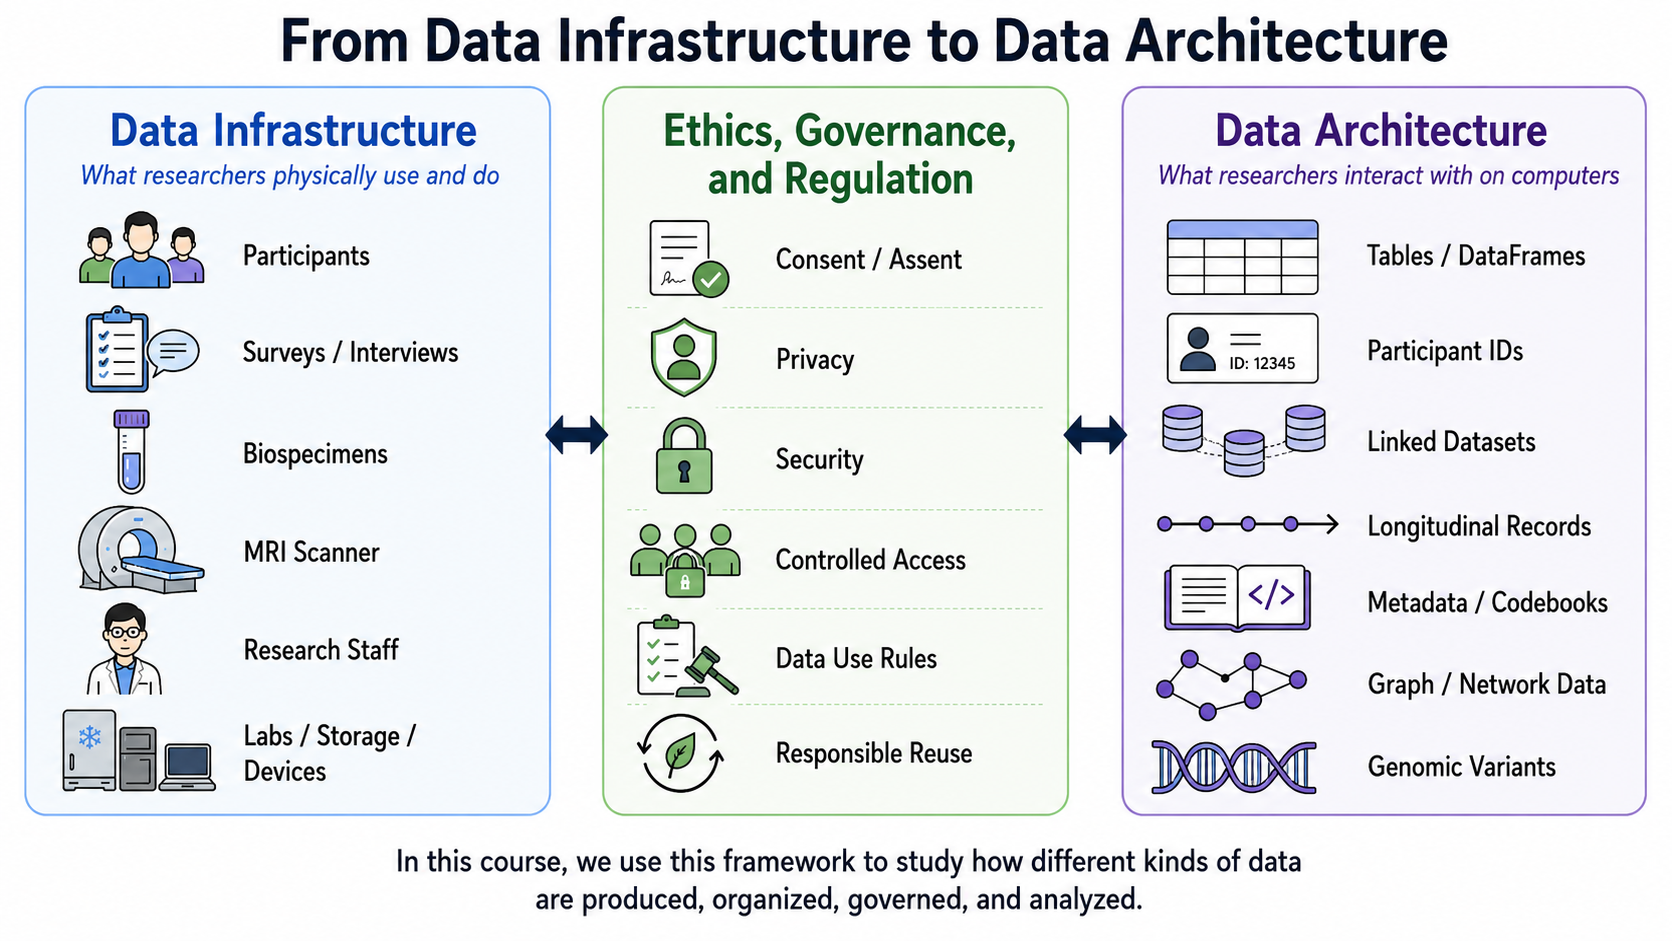
The goal of this course is to apply this framework to the data types and instruments represented in Figure 0.1. You will learn to connect research questions to measurable variables, interpret documentation and data structures, evaluate data quality and limitations, use Python to conduct transparent analyses, and communicate conclusions responsibly.
Although ABCD is a recurring example, students work with synthetic instructional datasets rather than restricted participant-level ABCD data. These datasets resemble selected features of real biomedical data, including repeated visits, multiple instruments, identifiers, missing-value codes, quality-control flags, and supporting documentation. They allow students to practice data analysis and reproducible workflow while protecting participant privacy.
The course GitHub repository is available here:
Companion Statistics Text
This textbook is designed to be used alongside:
Module Pairing Schedule
| Module | DSARM module topic | Paired statistical concepts from Vu & Harrington |
|---|---|---|
| M1 | The Biomedical Data Journey | – |
| M2 | Measuring Addiction & Youth Substance Use | Exploratory data analysis; numerical and categorical summaries; graphical displays (§1.2–1.7). |
| M3 | Attitudes, Environments, Data Quality & Cleaning | – |
| M4 | Behavioral Genetics & Addiction | Foundations of probability; rules of probability; random variables (§2.1–2.2). |
| M5 | Polygenic Traits & Addiction | Discrete and continuous probability distributions; binomial, normal, and Poisson distributions (§3.1–3.4). |
| M6 | Social Determinants of Addiction | Statistical inference; sampling variability; confidence intervals (§4.1–4.2). |
| M7 | Public Policy & Addiction | Hypothesis-testing framework; test statistics; Type I and Type II errors (§4.3–4.4). |
| M8 | Brain’s Reward System & Addiction | One- and two-sided tests; interpreting p-values; decision rules (§5.1–5.3). |
| M9 | Cue-Based Habits & Impulse Control | Statistical power; one-way ANOVA; comparing multiple group means (§5.4–5.6). |
| M10 | Capstone | – |