5 Endangered Species Protection and Recovery
The next chapter in the biologically-focused techniques group centers on endangered species protection and recovery, in particular, the United States Endangered Species Act. The Endangered Species Act defines the approach to species conservation, and is a prominent part of ecological conservation in the United States. In this chapter we will cover the history and effectiveness of the Endangered Species Act, the process of listing (or delisting) species, criteria for endangerment and recovery, and will end with a case study on shortnose sturgeon (Acipenser brevirostrum).
HISTORY OF THE U. S. ENDANGERED SPECIES ACT
The U. S. Endangered Species Act (ESA) was enacted in 1973 in reaction to congressional findings that various species of fish, wildlife, and plants in the United States had been rendered extinct as a consequence of economic growth and development, or had been so depleted in numbers that they were in danger of or threatened with extinction (United States Code 1973; Title 16, Sections 1531-1544) . In this Act, United States Congress deemed that these species have aesthetic, ecological, educational, historical, recreational, and scientific value for the Nation and its people. So the United States pledged itself to conserve to the extent practicable the various species of fish, wildlife and plants vulnerable to extinction (United States Code 1973). Thus, the purpose of the ESA is to protect and recover imperiled species and the ecosystems upon which they depend. The ESA is administered by the Interior Department’s United States Fish and Wildlife Service (USFWS) and the Commerce Department’s National Marine Fisheries Service (NMFS).
Several terms are used in relation to the ESA. For clarification, “endangered” means a species that is in danger of extinction throughout all or a significant portion of its range (USGS 2021). “Threatened” means a species is likely to become endangered within the foreseeable future. “Imperiled” and “at risk” are not legal terms under the ESA. Generally speaking, these species are animals and plants whose populations are in decline and may be in danger of extinction, which can include species that are at low enough numbers to be near extinction even though they are not legally protected under the ESA (USGS 2021). All species of plants and animals, except pest insects, are eligible for listing as endangered or threatened. Congress defined “species” to include subspecies, varieties, and for vertebrates, distinct population segments. In effect, the ESA constitutes a federal takeover of species management from state-level control.
LISTING SPECIES THROUGH THE ESA
Species are listed as endangered or threatened through the ESA solely on the basis of their biological status and threats to their existence. Five factors are considered when evaluating a species for listing (United States Code 1973; section 1533):
1) Damage to, or destruction of, a species’ habitat;
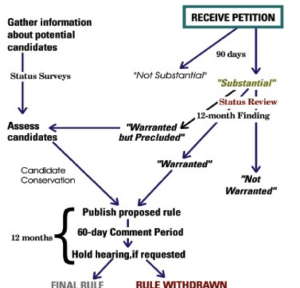
Species are proposed for listing (or delisting) through petitions which require published, peer reviewed findings (Figure 5.1). The average time from petition to listing is 12 years, with generally higher wait times for plants (Puckett et al. 2016). The USFWS also maintains a list of candidate species. These are species for which the USFWS has enough information to warrant proposing them for listing but are precluded from doing so by higher listing priorities. These “warranted but precluded” proposals require subsequent 12- month findings on each succeeding anniversary of the petition until the USFWS either undertakes a proposal or makes a “not warranted” ruling.
PROTECTION AND RECOVERY THROUGH THE ESA
The ESA protects endangered and threatened species and their habitats by prohibiting the “take” of listed species. Take includes activities that would harass, harm, pursue, hunt, shoot, wound, kill, trap, capture, collect or attempt to engage in any such conduct of any listed species (USFWS 2017). This includes significant habitat modification or degradation, by private or federal entities, that actually jeopardizes the continued existence of listed species by significantly impairing essential behavioral patterns, including breeding, feeding, or sheltering (USFWS 2017).
The goal of the ESA is to recover species so that they no longer need protection. Recovery plans describe the steps needed to restore a species to a healthy status. Agency biologists write and implement these plans with the assistance of species experts; other Federal, State, and local agencies; Tribes; nongovernmental organizations; academia; and other stakeholders (USFWS 2017).
FEDERAL AGENCY ACTIVITIES RELATED TO THE ESA
The laws of the ESA require Federal agencies to use their legal authorities to promote the conservation purposes of the ESA and work with the USFWS and NMFS to ensure that their actions are not potentially jeopardizing the continued existence of listed species. The USFWS or NMFS can make a jeopardy determination of potential actions and offer “reasonable and prudent alternatives” to avoid actions that may potentially harm a listed species (USFWS 2017). The ESA also requires the designation of “critical habitat” for listed species when “prudent and determinable.” Critical habitats are geographic areas that contain the physical or biological features that are essential for a listed species’ survival, even if the species is not currently occupying the area at the time of listing. Critical habitat designations affect only Federal agency actions, or federally funded or permitted activities. Federal agencies are required to avoid “destruction” or “adverse modification” of designated critical habitat (USFWS 2017). An area can be excluded from critical habitat designation if an economic analysis determines that the benefits of excluding it outweigh the benefits of including it, unless failure to designate the area as critical habitat could lead to extinction of the listed species. A process exists for exempting projects from the restrictions of the law if a Cabinet-level “Endangered Species Committee” (aka the “God Squad” due to the substantial impact of its decisions on the natural world) decides the benefits of the project clearly outweigh the benefits of conserving a species (USFWS 2017).
The Endangered Species Committee is composed of seven Cabinet-level members: the administrator of the Environmental Protection Agency, the administrator of National Oceanic and Atmospheric Administration, the chairman of the Council of Economic Advisers, a representative from the state in question, the Secretary of Agriculture, the Secretary of the Army, and the Secretary of the Interior. This committee has the authority to allow an extinction of a species by exempting a federal agency from certain requirements (known as “an exemption”). To grant an exemption, five of the seven members must vote in favor of the federal agency’s project. The following conditions must be met for an exemption to receive approval (United States Government Publishing Office 1978):
– There must be no reasonable alternative to the agency’s action.
Additionally, mitigation efforts must be taken to reduce the negative effects on the species in question.
Since its creation in 1978, the Committee has been convened only a handful of times: for the whooping crane (Grus americana) and snail darter (Percina tanasi) in 1979 and the Northern spotted owl (Strix occidentalis caurina) in 1992. In cases related to the whooping crane (Grus americana) and Northern spotted owl (Strix occidentalis caurina), the Endangered Species Committee chose to favor projects over species protection (Sheikh 2017). There were three other instances (in 1979, 1985 and 1986) in which applications were filed with the committee, but these applications were ultimately withdrawn or abandoned (Sheikh 2017).
HABITAT CONSERVATION PLANS AS PART OF THE ESA
Two-thirds of federally listed species have at least some habitat on private land, and some species have the majority of their remaining habitat on private land (USFWS 2017). The ESA provides relief to landowners who want to develop property inhabited by listed species. Landowners can receive a permit to take species under an approved habitat conservation plan (HCP). HCPs include steps to minimize and mitigate any adverse impacts, as well as funding to carry out the mitigation activities (USFWS 2017). Additionally, Safe Harbor Agreements (SHAs) provide regulatory assurance for non-Federal landowners who voluntarily aid in the recovery of listed species by improving or maintaining wildlife habitat (USFWS 2017). Under SHAs, landowners manage the enrolled property and may attempt to return it to originally agreed-upon “baseline” conditions for the species and its habitat by the end of the agreement, even if this results in the incidental take of that species (USFWS 2017).
OTHER ENDANGERED SPECIES SYSTEMS
The International Union for Conservation of Nature and Natural Resources (IUCN) has become the world’s most comprehensive information source on the global extinction-risk status of animal, fungus and plant species (IUCN 2021).
The North American Native Fishes Association (NANFA) maintains a spreadsheet of endangered, threatened and other special status fishes of North America (excluding Hawaii) (NANFA 2021). The information is compiled from federal, state and provincial natural resource agencies.
Additionally, many states have their own listings of endangered, threatened and special status species.
HOW MANY SPECIES ARE ENDANGERED
Species listings and delistings fluctuate year to year but the general trend over time is toward increasing listings (Figure 5.2) (World Economic Forum 2016).
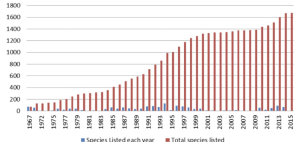
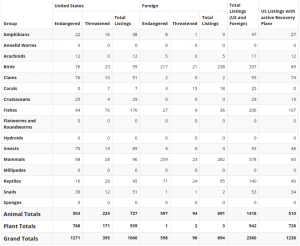
The USFWS maintains a tally of listed species, both domestic and foreign, and those with active recovery plans (Table 5.1). As of September 2021 in the United States, 1,271 species were listed as endangered (503 animals, 768 plants) and 395 as threatened (224 animals, 171 plants). In total, 1,666 species were listed (727 animals, 939 plants).
Table 5.1: Summary of United States and Foreign listed species and recovery plans as of September 2021. Twenty one animal species (13 in the United States and 8 Foreign) are counted more than once, primarily because these animals have distinct population segments (each with its own individual listing status). Source: United States Fish and Wildlife Service 2021
WHY ARE SPECIES ENDANGERED
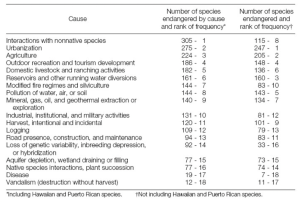
Animals and plants are endangered for a variety of reasons (Table 5.2). The most common causes of endangerment are interactions with nonnative species, urbanization and agriculture (Czech and Krausman 1997).
Table 5.2: Causes of endangerment of species classified as endangered and threatened by the United States Fish and Wildlife Service. Source: Czech and Krausman 1997
WHERE ARE THE SPECIES ENDANGERED
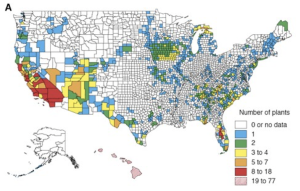
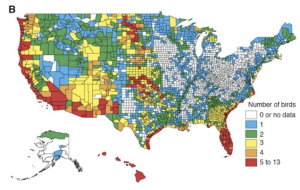
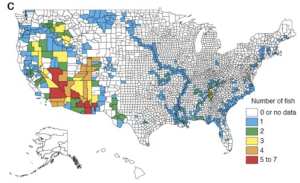
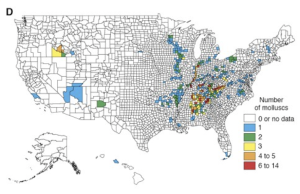
Dobson et al. 1997 detailed the distribution of endangered species throughout the United States for plants, birds, fish and molluscs (Figures 5.3a-d). Interestingly, they found that hot spots (areas with high numbers of endangered species) for different species groups rarely overlap, except where anthropogenic activities reduce natural habitat in centers of endemism (Dobson et al. 1997). They also found through their study that the amount of land that needs to be managed to protect currently endangered and threatened species in the United States is a relatively small proportion of the land mass (Dobson et al. 1997).
RESULTS OF THE SEA
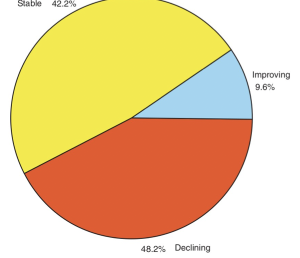
Male and Bean (2005) investigated whether the ESA was working to achieve significant results given available resources. They used data from recovery reports to the United States Congress covering the years 1988– 2002 to analyze the relationship between species status and years since listing under the ESA. Using these reports, they examined the association between recovery progress and taxonomy, funding, distribution on islands, designation of critical habitat, and US- FWS priorities and sought the degree to which those factors were correlated with species’ declining, stable, improving or unknown status.
Overall they found that slightly more than half (52%) of the species examined showed repeated improvement, or were not declining over this period of time (Figure 5.4) (Male and Bean 2005).
About thirteen years after being listed, 68% of the species whose status was known were reported as having stable or improving status (Figures 5.5 and 5.6) (Male and Bean 2005). About 35% of species remained in decline. This finding suggests that many species protected by the ESA have made progress toward recovery (Male and Bean 2005).
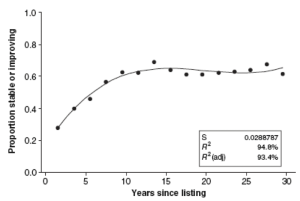
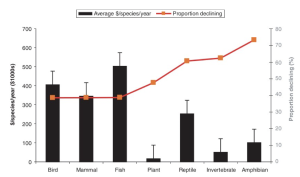
Recovery progress was significantly correlated with taxonomy, funding by the USFWS and National Oceanic and Atmospheric Administration (NOAA), agency assessment of risk of extinction, and recovery potential (Male and Bean 2005).
SPENDING ON THE ESA
Federal spending is <$1,000 per species per year for about 275 of the listed species (Male and Bean 2005). Twenty species received 52% of USFWS ($641 million in 2005) and 69% ($2.0 billion in 2005) of NOAA funding (Male and Bean 2005). Four salmon species accounted for $806 million (36%) of the NOAA/federal agency expenditure. The bald eagle (Haliaeetus leucocephalus) consumed $63.1 million (8%) of all USFWS spending reported. The designation of critical habitat was not correlated with improved status (Male and Bean 2005).
Through this research, it becomes clear that endangered species status assessments provide a far more detailed picture of recovery progress than what is currently being used to inform the debates over the efficacy of the ESA. It is also clear that funding priorities are very important because funding does make a difference in recovery success. However, it can take many years to see progress so patience is needed. Further, climate change will increase both species risk and management uncertainty, requiring more intensive and controversial management strategies to prevent species from going extinct (Evans et al. 2016). Already we are seeing that ocean warming, linked to anthropogenic climate change, is having an impact on the ecology of marine species around the world. In particular, climate-driven changes in ocean circulation have altered the foraging environment and habitat use of North Atlantic right whales (Eubalaena glacialis), reducing the population’s calving rate and exposing it to greater mortality risks from ship strikes and fishing gear entanglement (Meyer-Gutbord et al. 2021). Such a case exemplifies the increased threats to endangered species as a result of climate change, and lagging policy and economic support (e.g., financing the use of ropeless fishing gear for fishermen) to protect them.
SPECIES RECOVERY PLANS
One of three key provisions of the ESA are the recovery plans which are detailed programs for reducing the threat of extinction. These recovery plans are the only proactive part of the ESA law. Recovery criteria, the thresholds mandated by the ESA that define when species may be considered for downlisting or removal from the endangered species list, are a key component of conservation planning in the United States (Doak et al. 2015). Recovery plans for endangered or threatened species are designed in cooperation with a team of experts, not just by federal biologists.
Recovery plans have several parts. They include a review of biology, status of current populations, causes of endangerment, activities to support recovery, a schedule, and costs. Foin et al. (1998) detailed steps for improving recovery planning for threatened and endangered species. They analyzed 311 recovery plans to detect broad patterns that might increase a plan’s value.
Specifically, they sought to place the management plan for each listed species into one of three categories of management intensity, ranging from lowest management intensity (habitat preservation), to greater effort (habitat restoration), to highest intensity (active management) (Table 5.3) (Foin et al. 1998). Habitat preservation ensures that adequate habitat is protected or set aside to allow for natural population recovery. Habitat preservation is appropriate in cases where species are exploited or killed (e.g., the gray wolf (Canis lupus), and American alligator (Alligator mississippiensis)). This form of management was found in 37% of recovery plans (Foin et al. 1998). Habitat restoration is suggested in cases where inadequate or poor habitat conditions exist. With improved habitat quality and quantity, natural population recovery can be expected using habitat restoration techniques. Habitat restoration is appropriate where degraded and damaged habitat exists (e.g., many plants, or desert pupfish (Cyprinodon macularius)), the habitat needs are clearly known, and restoration is practical to implement. This form of management was found in 21% of recovery plans (Foin et al. 1998). Active management is suggested in cases where the above two strategies are unlikely to reverse species decline. These plans often require persistent management to maintain conditions. Active management is appropriate in cases where competition exists from either invasive or native species (e.g., Delmarva Peninsula fox squirrel (Sciurus niger cinereus) which needs high trees with no gray squirrels (Sciurus carolinensis) present, Florida scrub jay (Aphelocoma coerulescens) which requires patchy, burned land with invasive species removed). This form of management was found in 42% of recovery plans (Foin et al. 1998).
Table 5.3 Classification of species into the three management categories. Source: Foin et al. 1998
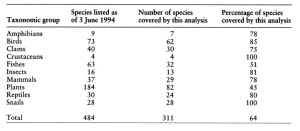
Overall, it is clear from the research done by Foin et al. (1998) that habitat conservation is the dominant issue for species recovery. Habitat preservation alone will not solve most cases as more active man- agement is needed for most species. Foin et al. (1998) warn that we must act quickly to implement recovery plans for most species since research often takes a long time to identify solutions.
Tear et al. (1993) analyzed 314 recovery plans to determine the validity of criticisms regarding the level of protection provided by the ESA. In particular, they sought to verify whether criticisms that recovery plans overprotect species and subpopulations are valid. They found that a common goal across recovery plans was to focus on a set population size. Surprisingly, 28% of the recovery plans actually specified set population levels lower than the population sizes that existed at the time of planning. Moreover, 37% of the plans specified the number of existing populations at or below levels that existed at the time of planning. In essence, 28-37% of species were being managed for extinction. Tear et al. (1993) concluded that more realistic goals were needed; specifically, they advised that policy should direct population size goals to achieve numbers which are higher than those that existed at the time a species was listed.
Doak et al. (2015) made recommendations for improving recovery criteria under the ESA. Specifically, they recommended improvements in the definition and scientific justification of recovery criteria, which addressed both data-rich and data-poor situations. Further, they recommended the use of quantitative population analyses to measure the impacts of threats, and that population status be explicitly tied to recovery criteria.
DISTINCT POPULATION SEGMENTS
In 1978, the ESA was amended to include “any subspecies of fish or wildlife or plants, and any distinct population segment of any species of vertebrate fish or wildlife which interbreeds when mature” (United States Government Publishing Office 1978; USFWS and NOAA 1996; Franklin). Notable here is the use of the phrase “distinct population segment” (DPS) as this expression is not used in science. Thus, available scientific information provides little to help in interpreting the actual meaning of DPS.
In policy however, a stock (e.g., a Pacific salmon (Oncorhynchus Suckley) “run”) is considered a DPS if it represents an evolutionarily significant unit of a biological species. There are two criteria that must be met for a DPS to be considered an evolutionarily significant unit: 1) It must be substantially reproductively isolated from other conspecific population units; and 2) It must represent an important component in the evolutionary legacy of the species (NOAA 2021).
To be a DPS, a population or group of populations must meet two criteria: discreteness and significance (Waples et al. 2018). These criteria are identified by the following elements:
1) Regarding the discreteness of the population segment in relation to the remainder of the species or subspecies to which it belongs, a population unit can be considered discrete if it satisfies either of the following conditions: a) It is markedly separated from other populations of the same taxon as a consequence of physical, physiological, ecological, or behavioral factors. Quantitative measures of genetic or morphological discontinuity may provide evidence of this separation; or b) It is delimited by international governmental boundaries within which differences in control of exploitation, management of habitat, conservation status, or regulatory mechanisms exist (Waples et al. 2018).
2) With respect to the significance of the population segment to the species or subspecies to which it belongs, the determination of significance may include: a) Persistence in an ecological setting that is unusual or unique for the taxon; b) Evidence that loss would result in a significant gap in the range of the taxon; c) Evidence that the DPS represents the only surviving natural occurrence of a taxon that may be more abundant elsewhere as an introduced population outside its historic range; or d) Evidence that the discrete population segment differs markedly from other populations of the species in its genetic characteristics (Waples et al. 2018).
3) Regarding the population segment’s conservation status in relation to the ESA’s standards for listing (i.e., endangered or threatened?); if a population segment is deemed discrete and significant, then it meets the criteria for a DPS and is evaluated for endangered and threatened status.
In a study of 492 plants and animals listed or proposed for listing between 1985 and 1991, 20% of the taxa proposed or listed during this period were subspecies or populations rather than full species (18% subspecies, 2% populations) (Table 5.4) (Wilcove et al. 1993). The proportion of listings involving subspecies or populations differed markedly among taxa. In general, vertebrates represented a higher proportion of subspecies or populations than did other taxa. For example, 80% of the birds and 70% of the mammals that were proposed for listing or actually listed represented subspecies or populations compared with just 5% for mollusks and 14% for plants (Wilcove et al. 1993).
Table 5.4: Breakdown of United States plants and animals listed or proposed for listing under the Endangered Species Act, 1985-1991. Source: Wilcove et al. 199

CRITERIA FOR ENDANGERMENT AND RECOVERY
Shaffer (1981) provided an early statement of a population security goal for species conservation. He proposed that a minimum viable population (MVP) for any given species in any given habitat is the smallest isolated population having a 99% chance of remaining extant for 1000 years, despite the foreseeable effects of demographic, environmental, and genetic stochasticity, and natural catastrophes. The MVP goal was later restated as a 10% probability of extinction within 100 years as the highest acceptable risk (Mace and Lande 1991).
Formal MVP estimates take data and time to develop. Thomas (1990) reviewed MVP results, existing models, and other empirical data to provide MVP guidelines for use when needed in species conservation. He stated that a population size of 10 is too small; genetic variation will be lost rapidly, and demographic extinction is likely to be swift. For the same reasons, a population size of 100 is also too small since environmental variation and natural catastrophes could easily reduce numbers to a level from which the population cannot recover. A population size of 1000 may be adequate provided the habitat is stable and secure, and reproduction is well mixed across the population. A population size of 10,000 “should normally be sufficient to permit long-term demographic persistence and to satisfy genetic considerations” (Thomas 1990).
Mace and Lande (1991) recognized that categories of the types of threats a species may encounter (e.g., endangered, threatened, vulnerable, etc.) are widely used and have become important tools in species conservation, and yet the definitions associated with these terms are highly subjective. They proposed a system to redefine categories in terms of the probability of extinction within specific time periods based on the theory of extinction time for individual populations and on meaningful time scales for conservation action. They defined four desirable characteristics of a classification system: 1) The system should be simple, with few categories, and based on extinction probabilities; 2) It should be flexible in data requirements and able to use whatever data exists; 3) It should also be flexible in the population unit being considered; and 4) The terminology used in categorization should be appropriate and the various terms used should have a clear relationship to one another (Mace and Lande 1991).
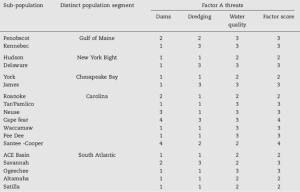
Table 5.5: Partial decision analysis matrix showing an extinction risk analysis, based on expert judgment, by sub-population and threat category for Atlantic sturgeon (Acipenser oxyrinchus) sub- populations. Source: Patrick and Damon-Randall 2008
Mace and Lande (1991) went on to propose the following categories of risk:
1) Vulnerable: 10% probability of extinction within 100 years. The 100 year time-span is considered workable for both planning purposes and for instances of urgency. This vulnerable designation is equivalent to the category of threatened under the ESA.
2) Endangered: 20% probability of extinction within 20 years or 10 generations, whichever is longer.
3) Critical: 50% probability of extinction within 5 years or 2 generations, whichever is longer.
Patrick and Damon-Randall (2008) created a framework based around five factors, which can be used to evaluate the status of data-poor species to determine extinction risk. They used a structured-decision approach for extinction risk assessment, which relied on expert judgment to assign a risk score to a species’ probability of extinction. This method is especially useful when the species’ life-history and population dynamics information are lacking. Their approach identified threats and organized them under the five factors specified in the ESA, as required for listing a species. The approach also identified populations or units of the species and made a decision analysis matrix of threats by population/unit. The cells of the decision analysis matrix were filled with scores, defined by experts, from 1 to 5 where:
1 = low risk (0–16% chance) of becoming endangered over the next 20 years.
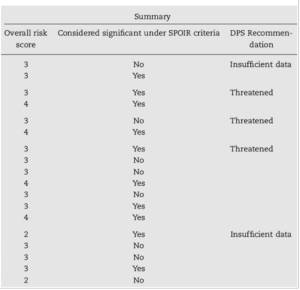
Table 5.6: Overall risk score and recommendations for Atlantic sturgeon (Acipenser oxyrinchus) sub- populations extinction risk analysis. Source: Patrick and Damon-Randall 2008
Patrick and Damon-Randall (2008) used Atlantic sturgeon (Acipenser oxyrinchus) sub-populations as an example to show the results of an extinction risk analysis (Table 5.5).
Following the completion of a decision analysis matrix, discussions regarding the sub-populations which received a score of 4 or 5 in any of their threat categories begin. Team members discuss their rationale for the scores they’ve assigned, and are given an opportunity to adjust their recorded score based on those discussions (Patrick and Damon-Randall 2008). Median values for threats are condensed into one score for each factor using the median score, the highest score, or the elevated score due to the cumulative effects of individual threats. The final step is to consolidate scores across factors into an overall sub-population score and state conclusions (Table 5.6). The overall sub- population score is calculated using the highest of the five factor scores as the final sub-population score.
For the Atlantic sturgeon (Acipenser oxyrinchus) sub-populations example, the review team determined through their analysis that the 18 sub-populations should be grouped into five DPSs. The team discussed the scores of the sub-populations that made up each DPS and, consistent with ESA language, decided whether those sub-populations that had scores of 4 or 5 constituted a significant portion of the range of the DPS (SPOIR). The review team concluded that the Carolina, Chesapeake and New York Bight DPSs had sufficient data to recommend listing, and that each had a >50% chance of becoming endangered in the next 20 years. Therefore, the team recommended that these three DPSs be listed as threatened (Patrick and Damon-Randall 2008).
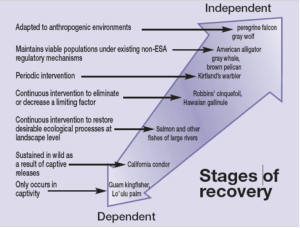
In some cases, recovery (delisting) is not attainable (Figure 5.7) (Scott et al. 2005). The recovery of a threatened or endangered species is often accompanied by the expectation that conservation management of the species will no longer be necessary. For many species the definition of recovery will need to include some form of active management. Recovery should be viewed as a continuum rather than a simple recovered vs not recovered condition.
Ongoing conservation management will require actions by state and local governments as well as private and governmental landowners. “Conservation-reliant species” can maintain self-sustaining wild populations with ongoing management actions (Scott et al. 2005). The criteria for assessing whether a species is conservation-reliant include:
1) Threats to the species’ continued existence are known and treatable;
2) The threats are pervasive and recurrent (e. g., nest parasites, nonnative predators);
3) The threats render the species at risk of extinction, absent ongoing conservation management;
4) Management actions sufficient to counter threats have been identified and can be implemented (e. g., prescribed fires, restrictions on grazing or public access, predator or parasite control); and
5) Federal, state, or local governments are capable of carrying out the necessary management actions as long as necessary.
CASE STUDY: SHORTNOSE STURGEON STATUS AND PATH TO RECOVERY
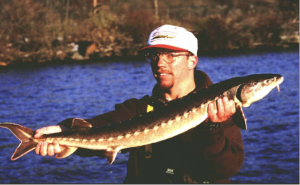
The shortnose sturgeon (e) is a diadromous fish species (Figure 5.8), with most populations living in large Atlantic coast rivers and estuaries along the east coast of North America (Kynard et al. 2016). Diadromous fish are migratory species that travel between fresh and salt water. There are no naturally land-locked populations, so all populations require access to fresh water and salt water to complete their natural life cycle (Kynard et al. 2016). River damming in the 19th and 20th Centuries extirpated some populations and caused other populations to become distinct, segmented populations (Kynard et al. 2016).
The shortnose sturgeon was formally protected with the passage of the 1968 United States Endangered Species Preservation Act and later designated endangered under the 1973 United States Endangered Species Act. In 1978 the ESA amended the listing for this species to include subspecies and distinct population segments. In 1987, the NMFS issued a shortnose sturgeon status review that suggested that the Androscoggin-Kennebec System supported only one population that may qualify for delisting. In 1994, Edwards Manufacturing Company petitioned the NMFS to delist the Androscoggin-Kennebec shortnose sturgeon population, citing an estimated population size of 11,000. The NMFS issued a finding in 1995 stating that the petition had merit and warranted a full review. The USFWS and NMFS issued a joint policy in 1996 on the criteria for determining distinct population segments. The NMFS issued a status review of the Androscoggin-Kennebec sturgeon, noting that there was an inadequate basis to conclude that there were two different populations.
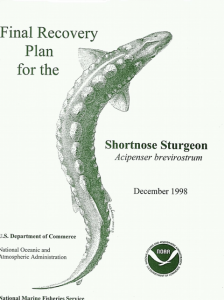
Later in the year, the NMFS made a decision to deny the petition to delist the Androscoggin-Kennebec sturgeon stating that some threats did exist and that the actual population size was 7,222. The NMFS concluded that there may be two populations, but that there was an inadequate basis for declaring the distinction. In 1998, the NMFS published a final recovery plan detailing criteria and status of the species (Figure 5.9). In its report, the NMFS recommended that 19 rivers should be managed as distinct population segments based on the strong fidelity of shortnose sturgeon to their natal rivers. A Biological Assessment completed in 2010 reaffirmed this approach (Shortnose Sturgeon Status Review Team 2010). However, the NMFS has not formally listed DPSs under the ESA and the species remains listed as endangered range-wide in the USA (Kynard et al. 2016).
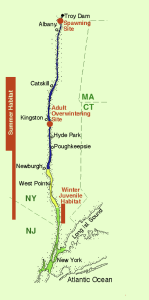
The population of shortnose sturgeon in the Hudson River is higher than in any other location along the east coast of the United States (Shortnose Sturgeon Recovery Team 1998). Shortnose sturgeon occupy the Hudson River estuary where habitats include a freshwater river channel, a low salinity fjord, and a brackish-water harbor (Figure 5.10). The 246 km Hudson River estuary is tidal and extends from New York City to the Troy Dam (upstream of Albany, New York) where the Hudson River is shallow, turbulent, and rises above sea level.
The availability and security of habitat is an important consideration in ESA listings. Random samplings from the Hudson River recorded that shortnose sturgeon were non-randomly distributed among several distinct river strata. Shortnose sturgeon were concentrated (63% of total fish catches) in the middle section of the estuary and were well represented (35% of catch) in habitats downstream to the point of persistently brackish waters (Figure 5.10) (Bain et al. 2007). The primary summer habitat for shortnose sturgeon is in the deep (regularly 13 to 42 m) tidal freshwater river channel used by commercial oil tankers and other sea ships (Figure 5.10) (Bain et al. 2007). Downstream, the estuary becomes brackish, deeper (regularly 18 to 48 m), and variable in width (Bain et al. 2007). The sections of the Hudson River primarily used by shortnose sturgeon have remained physically intact over the past century, with long-established shoreline land use that is composed of residential, historic, and some urban areas. The spawning site for shortnose sturgeon was removed from the other habitats because it was centered on turbulent river habitat between the head of tide and the Troy Dam. This section of the Hudson River was surrounded by urban areas and was immediately upstream from a river section heavily modified by industrial and shipping infrastructure.
From 1994 through 1997, gill net sampling was conducted for mark-and-recapture population estimates and a shortnose sturgeon distribution analysis (Bain et al. 2007). Sampling and marking were completed in two ways: 1) Random sampling was conducted from mid-May through early October throughout the river when the shortnose sturgeon were feeding and widely distributed; and 2) Targeted sampling of adult shortnose sturgeon, at a previously established (Klauda et al. 1988; Applied Science Associates 1999) overwintering site, was conducted in December, March, and early April, and at the spawning area from mid-April through May. Shortnose sturgeon were marked with internal (passive integrated transponder) tags and data were collected on fish length and weight (Bain et al. 2007).
In total, 6,265 individual shortnose sturgeon were captured and 5,959 of these fish were marked (Bain et al. 2007). Most (3,836) shortnose sturgeon were captured and marked at the overwintering site, high numbers (1,937) were captured and marked at the spawning site in spring, and relatively few (492) sturgeon were captured and marked in the summer random sampling that covered the estuary. From 1995 through 1997, 269 marked sturgeon were recaptured. The shortnose sturgeon captured during the targeted sampling were adults, while the summer random sampling captured a broader size range of shortnose sturgeon including some juveniles (Bain et al. 2007).
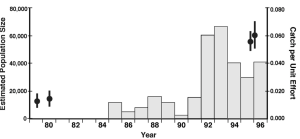
Using nine targeted sampling periods, a closed population estimate of the adults (Krebs 1989) yielded 56,708 fish with a narrow 95% confidence interval: 50,862 – 64,072 from the 1994-1997 study (Figure 5.11) (Bain et al. 2007). The mark-and-recapture estimator matched the method used in 1979 and 1980 which estimated the number of adult shortnose sturgeon at 12,669 and 13,844, respectively (Klauda et al. 1988; Dovel et al. 1992; Smith 1992; Applied Science Associates 1999). Comparing the 1994-1997 population abundance with estimates from 1979 and 1980, the Hudson River population has increased by more than 400%. Independent data from the Hudson River electric utilities trawl survey reflects approximately a 450% increase in average catch rate of mainly adult shortnose sturgeon from the 1980s to 1990s (Klauda et al. 1988; Applied Science Associates 1999).
The shortnose sturgeon recovery plan (Shortnose Sturgeon Recovery Team 1998) specifies three evaluation criteria: 1) A population of adequate size with a favorable trend in abundance; 2) Habitat that could sufficiently support a recovered population; and 3) Potential causes of mortality which would be insufficient to reduce the population size.
The number of sturgeon marked during the 1994-1997 study exceeded the estimated size of most other populations of shortnose sturgeon, and the population estimates were larger than the sum of all other estimated populations (seven other significant river populations) (Bain et al. 2007). Therefore, it was safe to conclude that the Hudson River supports the largest population of shortnose sturgeon, and that this system may harbor most of the individuals of this species.
A shortnose sturgeon population composed of 10,000 spawning adults has been considered large enough to be at a low risk of extinction (NOAA 1996a) and of adequate size for delisting under the ESA (NOAA 1996a, NOAA 1996b). Both the total and spawning population estimates in Bain et al. (2007) exceeded this threshold by a wide margin (≥500%), clearly indicating the recovery of the Hudson River shortnose sturgeon population. The Hudson River fish monitoring and the population estimates calculated over time, indicate a positive trend in shortnose sturgeon population abundance since the 1970s. These data, including size structure and condition, suggest that the population of shortnose sturgeon in the estuary is healthy. Further, shortnose sturgeon habitat use in the Hudson River is well understood and unlikely to be physically changed, water quality is closely monitored and regulated, and the habitats themselves have remained intact enough to support the growth of shortnose sturgeon into a considerably larger population. Future causes of high mortality such as unregulated harvest, bycatch in active fisheries, and pollution stress have been and can be controlled through established fishery management and water quality regulations. Finally, non-government conservation groups in the area are engaged and well funded (Haley et al. 1996).
The National Marine Fisheries Service is the responsible federal agency for planning and implementing recovery of shortnose sturgeon under the ESA. Their approach to species recovery in the Hudson River had been to minimize interference with natural population processes, to avert habitat disruption (e.g., channel dredging, open water disposal of dredged material, and bridge construction and demolition) and direct harm to individuals by capture, handling, and disturbance. Unlike a recovery strategy based on augmenting population size through stocking or active restoration, the Hudson River shortnose sturgeon population was managed for growth within protected habitat over a long period of time (approximately 30 years). The patient and natural approach to fish species recovery succeeded for the shortnose sturgeon in the Hudson River despite the intense human use and occupation of the river and its surroundings.
SUMMARY
The ESA program was enacted to protect and recover imperiled species and the ecosystems upon which they depend. Many species protected by the ESA have made progress toward recovery though patience is needed as it takes many years to see progress. Funding has been demonstrated to make a difference in recovery success. In the future climate change will increase both species risk and management uncertainty, requiring more intensive and controversial management strategies to prevent species from going extinct.
REFERENCES
Applied Science Associates, 1999. 1996 Year Class Report of the Hudson River Estuary monitoring program. Annual report to the Central Hudson Gas and Electric Corporation. Poughkeepsie, New York.
Bain, M.B., Haley, N., Peterson, D.L., Arend, K.K., Mills, K.E. and Sullivan, P.J., 2007. Recovery of a US endangered fish. PLoS One, 2(1), p.e168.
Czech, B. and Krausman, P.R., 1997. Distribution and causation of species endangerment in the United States. Science, 277(5329), pp.1116-1117.
Doak, D.F., Himes Boor, G.K., Bakker, V.J., Morris, W.F., Louthan, A., Morrison, S.A., Stanley, A. and Crowder, L.B., 2015. Recommendations for improving recovery criteria under the US Endangered Species Act. BioScience, 65(2), pp.189-199.
Dobson, A.P., Rodriguez, J.P., Roberts, W.M. and Wilcove, D.S., 1997. Geographic distribution of endangered species in the United States. Science, 275(5299), pp.550-553.
Dovel, W.L., Pekovitch, A.W. and Berggren, T.J., 1992. Biology of the shortnose sturgeon (Acipenser brevirostrum Lesueur, 1818) in the Hudson River estuary, New York. Estuarine Research in the 1980s. State University of New York Press, Albany, New York.
Evans, D.M., Che-Castaldo, J.P., Crouse, D., Davis, F.W., Epanchin-Niell, R., Flather, C.H., Frohlich, R.K., Goble, D.D., Li, Y.W., Male, T.D. and Master, L.L., 2016. Species recovery in the United States: Increasing the effectiveness of the Endangered Species Act. Issues in Ecology, 20, pp. 1-28.
Foin, T.C., Pawley, A.L., Ayres, D.R., Carlsen, T.M., Hodum, P.J. and Switzer, P.V., 1998. Improving recovery planning for threatened and endangered species. BioScience, 48(3), pp.177-184.
Haley, N., Boreman, J. and Bain, M., 1996. Juvenile sturgeon habitat use in the Hudson River. Section VIII in JR Waldman, WC Nieder, and EA Blair, editors. Final Report to the Tibor T. Polgar Fellowship Program, 995.
International Union for Conservation of Nature and Natural Resources (IUCN), 2021. Red List. Available: https://www.iucnredlist.org/ (September 2021).
Klauda, R.J., Muessig, P.H. and Matousek, J.A., 1988. Fisheries data sets compiled by utility-sponsored research in the Hudson River estuary. Fisheries Research in the Hudson River, State University of New York Press Albany.
Krebs, C., 1989. Ecological methodology. Harper Collins Publishers. New York, NY.
Kynard, B., Bolden, S., Kieffer, M., Collins, M., Brundage, H., Hilton, E.J., Litvak, M., Kinnison, M.T., King, T. and Peterson, D., 2016. Life history and status of Shortnose Sturgeon (Acipenser brevirostrum LeSueur, 1818). Journal of Applied Ichthyology, 32, pp.208-248.
Mace, G.M. and Lande, R., 1991. Assessing extinction threats: Toward a reevaluation of IUCN threatened species categories. Conservation biology, 5(2), pp.148-157.
Male, T.D. and Bean, M.J., 2005. Measuring progress in US endangered species conservation. Ecology Letters, 8(9), pp.986-992.
Meyer-Gutbrod, E.L., Greene, C.H., Davies, K.T. and Johns, D.G., 2021. Ocean regime shift is driving collapse of the North Atlantic right whale population. Oceanography, 34(3), pp.22-31.
North American Native Fishes Association (NANFA), 2021. Endangered, Threatened and Other Special Status Fishes of North America. Available: http://www.nanfa.org/bccconservation.shtml (September 2021).
National Oceanic and Atmospheric Administration (NOAA), 1996a. Listing endangered and threatened species: Shortnose sturgeon in the Androscoggin and Kennebec Rivers, Maine. Federal Register 61(201): 53893–53896.
National Oceanic and Atmospheric Administration (NOAA), 1996b. Status Review of shortnose sturgeon in the Androscoggin and Kennebec Rivers. Northeast Regional Office, National Marine Fisheries Service, unpublished report.
National Oceanic and Atmospheric Administration (NOAA), 2021. Questions and Answers for 12- Month Not Warranted Findings on the Petitions to List Oregon Coast and Southern Oregon and Northern California Coastal spring-run Chinook Salmon as Threatened or Endangered. Available: https:// www.fisheries.noaa.gov/west-coast/endangered-species-conservation/questions-and-answers-12- month-not-warranted-findings (September 2021).
Patrick, W.S. and Damon-Randall, K., 2008. Using a five-factored structured decision analysis to evaluate the extinction risk of Atlantic sturgeon (Acipenser oxyrinchus oxyrinchus). Biological Conservation, 141(11), pp.2906-2911.
Puckett, E.E., Kesler, D.C. and Greenwald, D.N., 2016. Taxa, petitioning agency, and lawsuits affect time spent awaiting listing under the US Endangered Species Act. Biological Conservation, 201, pp.220-229.
Scott, J.M., Goble, D.D., Wiens, J.A., Wilcove, D.S., Bean, M. and Male, T., 2005. Recovery of imperiled species under the Endangered Species Act: The need for a new approach. Frontiers in Ecology and the Environment, 3(7), pp.383-389.
Shaffer, M.L., 1981. Minimum population sizes for species conservation. BioScience, 31(2), pp.131- 134.
Sheikh, P. A., 2017. Endangered Species Act (ESA): The Exemption Process. Congressional Research Service Report R40787. Washington DC.
Shortnose Sturgeon Recovery Team, 1998. Final recovery plan for the shortnose sturgeon (Acipenser brevirostrum). US Dept. Commerce and Nat. Mar. Fish. Serv., NOAA.
Shortnose Sturgeon Status Review Team, 2010. A biological assessment of shortnose sturgeon (Acipenser brevirostrum). Report to the National Marine Fisheries Service. pp. 417.
Smith, C.L., 1992. Estuarine research in the 1980s. In Symposium on Hudson River Ecology 1989. State University of New York Press, Poughkeepsie, NY.
Tear, T.H., Scott, J.M., Hayward, P.H. and Griffith, B., 1993. Status and prospects for success of the Endangered Species Act: A look at recovery plans. Science, 262(5136), pp.976-978.
Thomas, C.D., 1990. What do real population dynamics tell us about minimum viable population sizes? Conservation biology, 4(3), pp.324-327.
United States Code, 1973. Title 16, Sections 1531-1544. Available: https://www.law.cornell.edu/us- code/text/16/chapter-35 (September 2021).
United States Fish and Wildlife Service, 2016. Listing a species as threatened or endangered. U. S. Fish and Wildlife Service, Endangered Species Program, Arlington, VA. Available: https://www.fws.gov/ endangered/esa-library/pdf/listing.pdf (September 2021).
United States Fish and Wildlife Service, 2017. ESA Basics: 40 years of conserving endangered species. Available: http://www.fws.gov/endangered/ (September 2021).
United States Fish and Wildlife Service, 2021. Listed species summary (Box score). Endangered Species. Available: https://ecos.fws.gov/ecp/report/boxscore (September 2021).
United States Fish and Wildlife Service and the National Oceanic and Atmospheric Administration, 1996. Policy regarding the recognition of distinct vertebrate population segments under the Endangered Species Act. Federal Register 61(26):4722-4725.
United States Geological Survey, 2021. Biology and Ecosystems. Available: https://www.usgs.gov/ faqs/what-are-differences-between-endangered-threatened-imperiled-and-risk-species?qt-news_science_products=0#qt-news_science_products (September 2021).
United States Government Publishing Office, 1978. 92 Stat. 3751. Available: https://www.govinfo.gov/link/statute/92/3751?link-type=pdf (September 2021).
Waples, R.S., Kays, R., Fredrickson, R.J., Pacifici, K. and Mills, L.S., 2018. Is the red wolf a listable unit under the US Endangered Species Act? Journal of Heredity, 109(5), pp.585-597.
Wilcove, D.S., McMillan, M. and Winston, K.C., 1993. What exactly is an endangered species? An analysis of the United States endangered species list: 1985–1991. Conservation Biology, 7(1), pp.87- 93.
World Economic Forum, 2016. Endangered species wait an average of 12 years to get on the list. Available: https://www.weforum.org/agenda/2016/08/endangered-species-wait-an-average-of-12-years- to-get-on-the-list (September 2021).

