6 Biomonitoring
The last chapter in the biologically-focused techniques group centers on the idea of using biological organisms to assess the biological integrity of a region. This method is called biomonitoring. The scientific principles underpinning biomonitoring have been applied to a variety of environments. This technique relies on the biological community to indicate problems and needs, and it is well developed for implementation in management. In this chapter, we will review the background and reasons for implementing biomonitoring, how it works, and will end with a case study on the New York biomonitoring program.
BACKGROUND ON BIOMONITORING
Historically, policy and management goals have focused on reducing point source pollution which is the pollution that can be traced to a specific location (e.g., end-of-a-pipe). Standards have been used in the past to set limits on amounts of pollutants but there are problems with the use of standards. First, standards are not always linked with ecosystem health. Second, the goal of environmental management is to protect natural ecosystems; standards are not focused on that goal. Thus, the focus of environmental protection has broadened from the sole use of standards to restoring self-maintaining ecosystems.
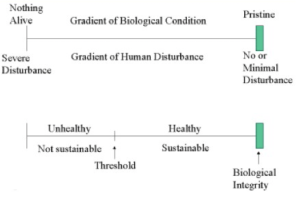
One objective of the Clean Water Act (CWA) is restoring and maintaining the “…chemical, physical, and biological integrity of the Nation’s waters…” (United States Code, 2021). The biological integrity mandate of the CWA depends on an overview of the entire water system, not just on water quality which historically was the focus. The biological integrity objective (Figure 6.1) encompasses all factors affecting the ecosystem and is defined as “the capability of supporting and maintaining a balanced, integrated, adaptive community of organisms having a species composition, diversity, and functional organization comparable to that of natural habitat of the region” (Karr 1991). Thus, biomonitoring programs help to view rivers as living systems and to use accessible biological organisms in management programs.
The United States Environmental Protection Agency (USEPA) began developing new approaches for biomonitoring with James Karr in the 1970s. After seven years of study in creeks and rivers in Indiana and Illinois, Karr published his first article demonstrating the assessment of biotic integrity using fish communities (Karr 1981). His article emphasized the ability to sustain a balanced biotic community as this is one of the best indicators of the potential for the beneficial use of waterbodies (Karr 1981). Though Karr was trained as an ornithologist, he used fish as the biotic community to link fauna to biotic integrity. His work ultimately became the dominant concept for biomonitoring in the United States.
WHY PERFORM BIOMONITORING
Initially, there was limited use of integrative biological techniques to protect water resources. This was due to a number of reasons: 1) Dominance of the reductionist viewpoint; 2) Lack of interdisciplinary breadth; 3) Inability to deal with the whole system; 4) Limited legal and regulatory programs; 5) Fragmented responsibility (e.g., federal, state, local); 6) Few tools to evaluate regulatory programs; 7) Numerical pollution standards were clear and could be justified; and 8) Non-point source pollution was hard to link to water changes directly.
In his paper, Karr (1981) asserts that by carefully monitoring fishes, one can rapidly and inexpensively assess the health of a local water resource, and that this process can serve as an exploratory assessment of overall water resource quality. Where impaired use is suggested by biological monitoring, a more nearly complete monitoring program can be implemented in search of the cause of the impairment (Karr 1981).
HOW BIOMONITORING WORKS
Biomonitoring (Figure 6.2) is performed using indices to assess biological integrity (called an Index of Biotic
Integrity or IBI). These IBIs were developed by correlating metrics related to the biological organism being assessed (e.g., fish) with ecological health. IBIs must be able to capture the range of conditions indicating integrity. Metrics of importance vary from place to place, so IBIs are often developed for specific regions, though field methods are typically standardized.
Unlike other management techniques that use standards, where effluent limits are enforceable but waterways remain impaired in most cases, biomonitoring processes link field data to enforceable actions.
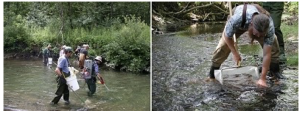
The fundamental objective of biomonitoring is to describe the effects of human activities on the structure and function of ecosystems and their biota (Stoddard et al. 2006).
Most biological assessments are based, either directly or indirectly, on the concept of comparing factors of current condition to natural conditions (structure, composition, function, or diversity) in the absence of human disturbance or alteration (i.e., comparison to a pristine, unpolluted, or anthropogenically undisturbed state). This natural condition is termed the reference condition.
DEFINING THE REFERENCE CONDITION
Several methods for estimating natural conditions have been developed for use as reference against collected data (Stoddard et al. 2006). The reference-site approach is by far the most common. In this approach, one would quantify the biological condition at a set of sites that are either minimally or least disturbed by human activity and these would comprise the reference (or natural) sites (Davies and Jackson 2006). Minimally disturbed condition sites are places that have escaped all but the broadest scale human disturbances and are often protected areas or forested landscapes with remnants of late- stage/old-growth watersheds, or landscapes that have substantially recovered from past disturbances (Stoddard et al. 2006). Long-term climatic, geologic, and ecological fluctuations will inevitably change the characteristics of individual sites in this group, but the range of minimally disturbed conditions should be nearly invariant, and its distribution can serve as an anchor by which to judge current condition (Stoddard et al. 2006). Least disturbed condition sites are those which have comparatively less human disturbance than other sites (Stoddard et al. 2006). These constitute the best available physical, chemical, and biological habitat conditions given the current state of the landscape. Least disturbed condition sites are ideally described by evaluating data collected at sites selected according to a set of explicit criteria defining what is “best” (i.e., those least disturbed by human activities) (Stoddard et al. 2006). The best attainable condition is equivalent to the expected condition of least disturbed condition sites if the best possible management practices were in use for some period of time. The preferred approach for estimating either the minimally disturbed condition or least disturbed condition is to use a set of criteria for site selection that exclude data on resident biota to avoid circularity. The structure of the biotic assemblage itself should not be used to classify sites as either reference or non-reference because it is important to avoid any preconceived notions about the structure and composition of biotic assemblages at reference sites (Stoddard et al. 2006).
Other methods for estimating natural or reference conditions include: 1) Interpreting historical conditions; 2) Extrapolating from empirical models; and 3) Best professional judgment. In some cases it is possible to interpret the historical condition of a site by examining documents from earlier times or through museum collections, journals, records written by early explorers, land survey notes, or early photographs (Stoddard et al. 2006). The historical condition can be an accurate estimator of natural conditions if the historical point chosen is before the start of any human disturbance. However, many other historical reference points are possible (e.g., pre-industrial, pre-Columbian). In North America, a historical period that includes the impacts of indigenous peoples, but excludes the impacts of European immigrants, has been labeled the pre-Columbian benchmark (Stoddard et al. 2006).
In situations without minimally disturbed condition sites, empirical models derived from associations between biological indicators and human-disturbance gradients can be extrapolated to infer conditions in the absence of humans (Stoddard et al. 2006). Biologists with decades of experience sampling and examining physical, chemical, and biological attributes across wide ranges of severity and types of human disturbance, may develop an empirical understanding of conditions in the absence of significant human disturbance. These judgments would constitute best professional judgment (Stoddard et al. 2006).
BIOTIC INDEXING
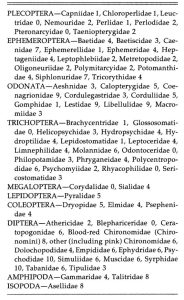
Rating community samples using species “tolerances” to pollution seems to have started with William Hilsenhoff, a Wisconsin state biologist, at the start of the 1980s (Hilsenhoff 1982). The system has become known as the “Hilsenoff index” or biotic index. An updated version of the biotic index was released by Hilsenhoff (1988) using family-level stream macroinvertebrates to identify the quality of stream habitat. The biotic index process involves obtaining a representative sample of stream organisms, separating the organisms by taxa, multiplying the abundance of each taxon by its pollution tolerance value to obtain a score for each taxa, summing the scores, and then dividing the final score by the number of organisms (Figure 6.3).
The resulting family biotic index value can be used to determine an overall water quality rating from very poor to excellent (Table 6.1).
Table 6.1: Evaluation of water quality using family level biotic index. Source: Hilsenhoff 1988

The advantages of the biotic index are that it is rapid, low cost, and easy to implement, and it provides information on the health of the site. The index is based on biological measurements which provide a broad perspective of the quality of the waterbody from which they were obtained. The ratings and scores were developed based on abundant field experience by expert biologists.
INDEX OF BIOTIC INTEGRITY (IBI)
The IBI was conceived to provide a broadly based and ecologically sound tool to evaluate biological conditions in flowing waters (Karr 1991). Research has successfully linked macroinvertebrate community impairment, identified through biomoniotring protocols such as the IBI, to catchment characteristics in streams (Kennen 1999). IBIs are now widely used by states, provinces, and federal agencies (e.g., United States Environmental Protection Agency) for status assessment and monitoring.
While first used for fish (Karr 1991), the IBI has an ecological foundation that allows for its use with any taxa group, and it can be scaled up for use with multiple taxa (e.g., IBIs exist for birds (Alexandrino et al. 2017), bacteria (Li et al. 2017), phytoplankton (Ren et al. 2017), and other organisms). It uses a set of metrics that represent populations, communities, and ecosystems, and a scoring system that ranges from 1 to 5 with 1 indicating strong deviation from the reference condition, 3 denoting moderate deviation, and 5 representing a condition close to the reference condition. An innovation of the IBI is that the values used for metrics are based on comparison to a regional reference condition with little or no human influence.
The IBI is implemented by sampling a site for organisms (e.g., fish), assessing the sample in terms of the IBI metrics, giving a rating score for each metric (e.g., 5, 3 or 1; Table 6.2), summing the scores across the metrics to obtain a total IBI score, and then assessing the integrity class of the site (e.g., very poor to excellent) based on the total IBI score (Table 6.3).
Table 6.2: Metrics used to assess the biological integrity of fish communities based on an Index of Biotic Integrity (IBI). Ratings of 5, 3 and 1 are assigned to each metric according to whether its value approximates, deviates from, or strongly deviates from the value expected at a comparable site that is relatively undisturbed. Source: Karr 1991
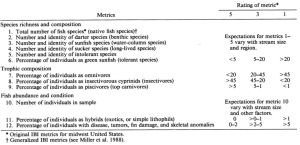
Table 6.3: Total Index of Biotic Integrity (IBI) scores, integrity classes, and the attributes of those classes. Source: Karr 1991
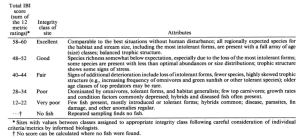
The main advancements of the IBI are that it provides a quantitative measure of human disturbance, incorporates attributes of biological systems, leverages professional judgment in an ecologically sound manner, is inexpensive, simple, and highly sensitive to ecosystem changes, translates ecological knowledge into statements about the health of ecosystems, uses categories of metrics to span changes expected under stress, and involves minimal information loss in its use of metrics.
CASE STUDY: NEW YORK STATE BIOMONITORING
A biological monitoring program was initiated in New York State in May 1972 as mandated by the Federal Water Pollution Control Act Amendments of 1972 (Figure 6.4) (Public Law 92-500; United States Fish and Wildlife Service 2021). The main objective of the project was to evaluate the relative biological health of the State’s streams and rivers through the collection and analysis of macroinvertebrate organisms.
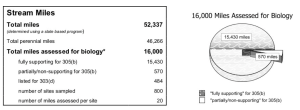
Biological data from sites within the Rotating Intensive Basin Survey (RIBS) basins are combined with chemical data to make overall water quality assessments of the sites (Figure 6.5).
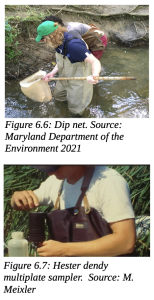
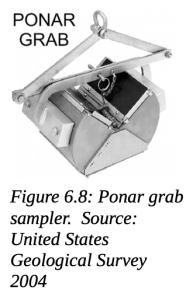
Sampling methods involve the use of dip nets with >800 micron mesh (Figure 6.6), hester-dendy multiplate samplers (Figure 6.7), and ponar grab samplers (Figure 6.8) depending on the depth of the water.
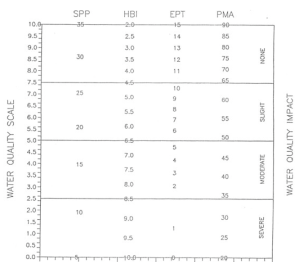
Sampled data can be analyzed using a variety of indices (Figure 6.9). Four of the most popular are:
1) Species richness. This is the total number of species or taxa found in the sample. Expected ranges for 100-organism subsamples of dip net samples in most streams in New York State are:
> 26 = non-impacted
19-26 = slightly impacted 11-18 = moderately impacted < 11 = severely impacted
2) Ephemeroptera, Plecoptera, Trichoptera (EPT) value. EPT denotes the total number of species of mayflies (Ephemeroptera), stoneflies (Plecoptera), and caddisflies (Trichoptera) found in an average 100-organism subsample. These are considered to be mostly clean-water organisms, and their presence is generally correlated with good water quality (Lenat 1987). Expected ranges from most streams in New York State are:
>10 = non-impacted
6-10 = slightly impacted 2-5 = moderately impacted 0-1 = severely impacted
3) Biotic index. The Hilsenhoff Biotic Index is a measure of the tolerance of the organisms in the sample to organic pollution (e.g., sewage effluent, animal wastes) and low dissolved oxygen levels. It is calculated by multiplying the number of individuals of each species by its assigned pollution tolerance value, summing these products, and dividing by the total number of individuals. On a 0-10 scale, tolerance values range from intolerant (0) to tolerant (10). For purposes of characterizing an organism’s pollution tolerance, intolerant = 0-4, facultative = 5-7, and tolerant = 8-10 (Hilsenhoff 1987); additional values are assigned to organisms by the New York State Stream Biomonitoring Unit (Bode et al. 1996). Ranges for the levels of impact are:
0-4.50 = non-impacted
4.51-6.50 = slightly impacted 6.51-8.50 = moderately impacted 8.51-10.00 = severely impacted
4) Percent Model Affinity. Percent Model Affinity is a measure of similarity to a model non-impacted community based on percent abundance in seven major groups (Novak and Bode 1992). This index provides water quality information not entirely contained in other indices. It is based on the concept that the biological effects of pollutants can be measured by comparing the existing community with an expected community, a practice that many biologists carry out intuitively. Percent affinity is used to measure similarity to a model community of 40% Ephemeroptera, 5% Plecoptera, 10% Trichoptera, 10% Coleoptera, 20% Chironomidae, 5% Oligochaeta, and 10% Other. Ranges for the levels of impact are:
> 64 = non-impacted
50-64 = slightly impacted 35-49 = moderately impacted < 35 = severely impacted
Each of the indices provides a quality rating of non-impacted, slightly impacted, moderately impacted or se-verely impacted (Table 6.4). These can be interpreted as follows:
Non-impacted: Indices reflect very good water quality. The macroinvertebrate community is diverse, usually with at least 27 species in riffle habitats. Mayflies, stoneflies, and caddisflies are well represented; the EPT value is greater than 10. The biotic index value is 4.50 or less. Percent model affinity is greater than 64. Water quality should not be limiting to fish survival or propagation. This level of water quality includes both pristine habitats and those receiving discharges which minimally alter the biota.
Slightly impacted: Indices reflect good water quality. The macroinvertebrate community is slightly but not significantly altered from the pristine state. Species richness usually is 19-26. Mayflies and stoneflies may be restricted, with EPT values of 6-10. The biotic index value is 4.51-6.50. Percent model affinity is 50-64. Water quality is usually not limiting to fish survival, but may be limiting to fish propagation.
Table 6.4: Water quality assessment criteria ranges for non-navigable flowing waters for species richness, Hilsenhoff biotic index, EPT value, and percent model affinity. Source: Bode et al. 2001
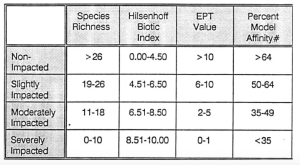
Moderately impacted: Indices reflect poor water quality. The macroinvertebrate community is altered to a large degree from the pristine state. Species richness usually is 11-18 species. Mayflies and stoneflies are rare or absent, and caddisflies are often restricted; the EPT value is 2-5. The biotic index value is 6.51-8.50. The percent model affinity value is 35-49. Water quality is often limiting to fish propagation, but usually not to fish survival.
Severely impacted: Indices reflect very poor water quality. The macroinvertebrate community is limited to a few tolerant species. Species richness is 10 or less. Mayflies, stoneflies, and caddisflies are rare or absent; EPT value is 0-1. The biotic index value is greater than 8.50. Percent model affinity is less than 35. The dominant species are almost all tolerant, and are usually midges and worms. Often only 1-2 species are found in the waterbody.
There are a number of advantages to using macroinvertebrates as water quality indicators (Bode et al. 1995):
- They are sensitive to environmental impacts
- They are less mobile than fish, and thus cannot avoid discharges
- They can indicate effects of spills, intermittent discharges, and lapses in treatment
- They are indicators of overall integrated water quality, including synergistic effects and substances lower than detectable limits
- They are abundant in most streams and are relatively easy and inexpensive to sample
- They are able to detect non-chemical impacts to the habitat, such as siltation or thermal changes
- They are vital components of the aquatic ecosystem and important as a food source for fish
- They are more readily perceived by the public as tangible indicators of water quality
- They can often provide an on-site estimate of water quality
- They can often be used to identify specific stresses or sources of impairment
- They can be preserved and archived for decades, allowing for direct comparison of specimen across time
- They bioaccumulate many contaminants, so that analysis of their tissues is a good monitor of toxic substances in the aquatic food chain
Some limitations also apply (Bode et al. 1995):
1) Biological monitoring is not intended to replace chemical sampling, toxicity testing, or fish surveys. Each of these measurements provides information not contained in the others
2) Substances may be present at levels exceeding ambient water quality criteria, yet have no apparent adverse community impact
3) Macroinvertebrate sampling cannot determine if water is safe for drinking
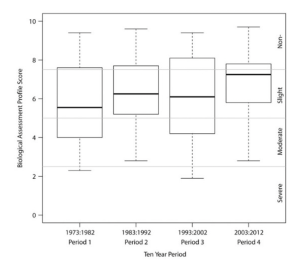
In a long-term survey of 40 years of monitoring, Smith et al. (2018) noted some successes with the use of biological monitoring. Shifts in the amount of pollutants and regulation of streams and rivers of New York between 1972 and 2012 resulted in small, incremental improvements in biological indicators, and a shift from point source dominated pollution to nonpoint sources (Figure 6.10) (Smith et al. 2018). From 1972 to 2012, 33% of the large river sites sampled had improved, while 13% had declined in biological assessment scores for water quality; 58% of the wadeable stream sites sampled showed no change (Smith et al. 2018). Macroinvertebrate community models suggest that impact sources are now dominated by nonpoint nutrient sources (Smith et al. 2018).
SUMMARY
Many states and local organizations have active and ongoing biomonitoring programs which use biological organisms to assess the biological integrity of a region. Biomonitoring can occur with a variety of different organisms (e.g., fish, macroinvertebrates, birds, frogs) and can use a variety of different indices (e.g., species richness, EPT, biotic index, percent model affinity) to evaluate ecosystem health. The field of biomonitoring has received a great deal of attention in the past and indices at the local and regional levels are continually being created and improved
REFERENCES
Alexandrino, E.R., Buechley, E.R., Karr, J.R., de Barros, K.M.P.M., de Barros Ferraz, S.F., do Couto, H.T.Z. and Şekercioğlu, Ç.H., 2017. Bird based Index of Biotic Integrity: Assessing the ecological condition of Atlantic Forest patches in human-modified landscape. Ecological indicators, 73, pp.662- 675.
Bode, R.W., Novak, M.A. and Abele, L.E., 1995. Schoharie Creek Biological Assessment. New York State Department of Environmental Conservation, Division of Water, Bureau of Monitoring and Assessment.
Bode, R.W., Novak, M.A., Abele, L.E., Heitzman, D.L. and Smith, A.J., 1996. Quality assurance work plan for biological stream monitoring in New York State. Stream Biomonitoring Unit, Bureau of Monitoring and Assessment, Division of Water, NYS Department of Environmental Conservation.
Bode, R.W., Novak, M.A., Abele, L.E., Heitzman, D.L. and Unit, S.B., 2001. Biological stream assessment. New York State Department of Environmental Conservation.
Davies, S.P. and Jackson, S.K., 2006. The biological condition gradient: a descriptive model for interpreting change in aquatic ecosystems. Ecological Applications, 16(4), pp.1251-1266.
Hilsenhoff, W.L., 1982. Using a biotic index to evaluate water quality in streams (No. 132). Department of Natural Resources, Madison, WI.
Hilsenhoff, W.L., 1987. An improved biotic index of organic stream pollution. The Great Lakes Entomologist, 20(1), p.7.
Hilsenhoff, W.L., 1988. Rapid field assessment of organic pollution with a family-level biotic index. Journal of the North American benthological society, 7(1), pp.65-68.
Karr, J.R., 1981. Assessment of biotic integrity using fish communities. Fisheries, 6(6), pp.21-27.
Karr, J.R., 1991. Biological integrity: A long-neglected aspect of water resource management.Ecological applications, 1(1), pp.66-84.
Karr, J.R. and Chu, E.W., 1999. Restoring life in running waters. Island Press.
Kennen, J.G., 1999. Relation of macroinvertebrate community impairment to catchment characteristics in New Jersey streams. JAWRA Journal of the American Water Resources Association, 35(4), pp.939- 955.
Lenat, D.R., 1987. Water quality assessment using a new qualitative collection method for freshwater benthic macroinvertebrates. North Carolina DEM Tech. Report, 12.
Li, J., Li, Y., Qian, B., Niu, L., Zhang, W., Cai, W., Wu, H., Wang, P. and Wang, C., 2017. Development and validation of a bacteria-based index of biotic integrity for assessing the ecological status of urban rivers: A case study of Qinhuai River basin in Nanjing, China. Journal of environmental management, 196, pp.161-167.
Maryland Department of the Environment, 2021. Maryland’s High Quality Waters. Available: https://mde.maryland.gov/programs/water/tmdl/waterqualitystandards/pages/ antidegradation_policy.aspx (September 2021).
Novak, M. and Bode, R.W., 1992. Percent model affinity: A new measure of macroinvertebrate community composition. Journal of the North American Benthological Society, 11(1), pp.80-85.
Ren, L., Belton, T.J., Schuster, R. and Enache, M., 2017. Phytoplankton index of biotic integrity and reference communities for Barnegat Bay–Little Egg Harbor, New Jersey: A pilot study. Journal of Coastal Research, (78 (10078)), pp.89-105.
Smith, A.J., Duffy, B.T., Onion, A., Heitzman, D.L., Lojpersberger, J.L., Mosher, E.A. and Novak, M.A., 2018. Long-term trends in biological indicators and water quality in rivers and streams of N ew Y ork S tate (1972–2012). River Research and Applications, 34(5), pp.442-450.
Stoddard, J.L., Larsen, D.P., Hawkins, C.P., Johnson, R.K. and Norris, R.H., 2006. Setting expectations for the ecological condition of streams: The concept of reference condition. Ecological applications, 16(4), pp.1267-1276.
United States Code, 2021. Chapter 26 – water pollution prevention and control. Available: http://us- code.house.gov/view.xhtml?req=granuleid%3AUSC-prelim-title33-chapter26&edition=prelim (September 2021).
United State Environmental Protection Agency, 2002. Summary of biological assessment programs and biocriteria development for states, tribes, territories, and interstate commissions: Streams and wadeable rivers. EPA-822-R-02-048.
United States Fish and Wildlife Service, 2021. Digest of Federal Resource Laws of Interest to the United States Fish and Wildlife Service. Available: https://www.fws.gov/laws/lawsdigest/FWATRPO.HTML (September 2021).
United States Geological Survey, 2004. Grab samplers. Available: https://woodshole.er.usgs.gov/ openfile/of2005-1001/htmldocs/samplers/grab/ponar.htm (September 2021).
Vermont Department of Environmental Conservation, 2021. Biomonitoring. Available: https:// dec.vermont.gov/watershed/map/monitor/biomonitoring (September 2021).

